📊 Executive Summary
✓ Statistical Validation Complete
Three independent tests confirm samples are from the same population:
- Persona Distribution: χ² = 1.39, p = 0.845 (No significant difference)
- Budget Distribution: χ² = 3.04, p = 0.694 (No significant difference)
- WTP Means: t = 1.42, p = 0.155, Cohen's d = -0.168 (Negligible effect)
Conclusion: Safe to combine datasets. Soft launch (n=84) and full launch (n=517) show no statistically significant differences in demographics, budget distribution, or WTP patterns.
Why Use Combined Dataset?
- Increased Statistical Power: 601 responses vs 517 (16% increase)
- Tighter Confidence Intervals: 95% CI narrows from ±$4.67 to ±$4.36
- More Robust Segmentation: Larger sample sizes per persona (avg 120 vs 103)
- Stronger Feature Correlations: Better detection of small-to-medium effects
- Adequate Power for Subgroups: Can analyze segments with n ≥ 30 reliably
📈 Combined Dataset Key Metrics
Combined Dataset Summary (n=601)
84 Soft Launch + 517 Full Launch = 601 Total Responses
| Metric | Soft Launch (n=84) | Full Launch (n=517) | Combined (n=601) ⭐ |
|---|---|---|---|
| Sample Size | 84 | 517 | 601 |
| Mean WTP | $80.68 | $71.57 | $72.85 |
| Median WTP | $63.00 | $63.00 | $63.00 |
| Standard Deviation | $55.87 | $53.98 | $54.34 |
| 95% Confidence Interval | ±$11.98 | ±$4.67 | ±$4.36 (Best) |
| Statistical Power | Medium | High | Maximum |
👥 Combined Persona Analysis (n=601)
Enhanced Precision with Larger Sample: Combined dataset provides 30+ responses per persona (minimum for statistical validity), with some personas having 150+ responses for highly reliable insights.
Target Market Validation
74.1% of combined market is Small Business Owners (48.6%) + Enterprise (25.5%) with proven WTP. With 445 combined responses in these segments, pricing strategy has high confidence.
📊 Statistical Power with Combined Dataset
Segment Analysis
Adequate Power For:
- 5-10 market segments
- All persona comparisons
- Budget tier analysis
- Technology platform segments
Correlation Analysis
Can Detect:
- Correlations r ≥ 0.15 (small)
- Medium effects (r ≥ 0.30)
- Feature-WTP relationships
- Preference patterns
Subgroup Analysis
Valid Analysis For:
- Any subgroup n ≥ 30
- Cross-segment comparisons
- Technology platform cohorts
- Budget tier segmentation
Confidence Intervals
Precision Achieved:
- WTP: ±$4.36 (95% CI)
- Proportions: ±3-5%
- Tight error margins
- Reliable estimates
📊 Combined Dataset Visualizations (Click images to enlarge)
Combined WTP Distribution
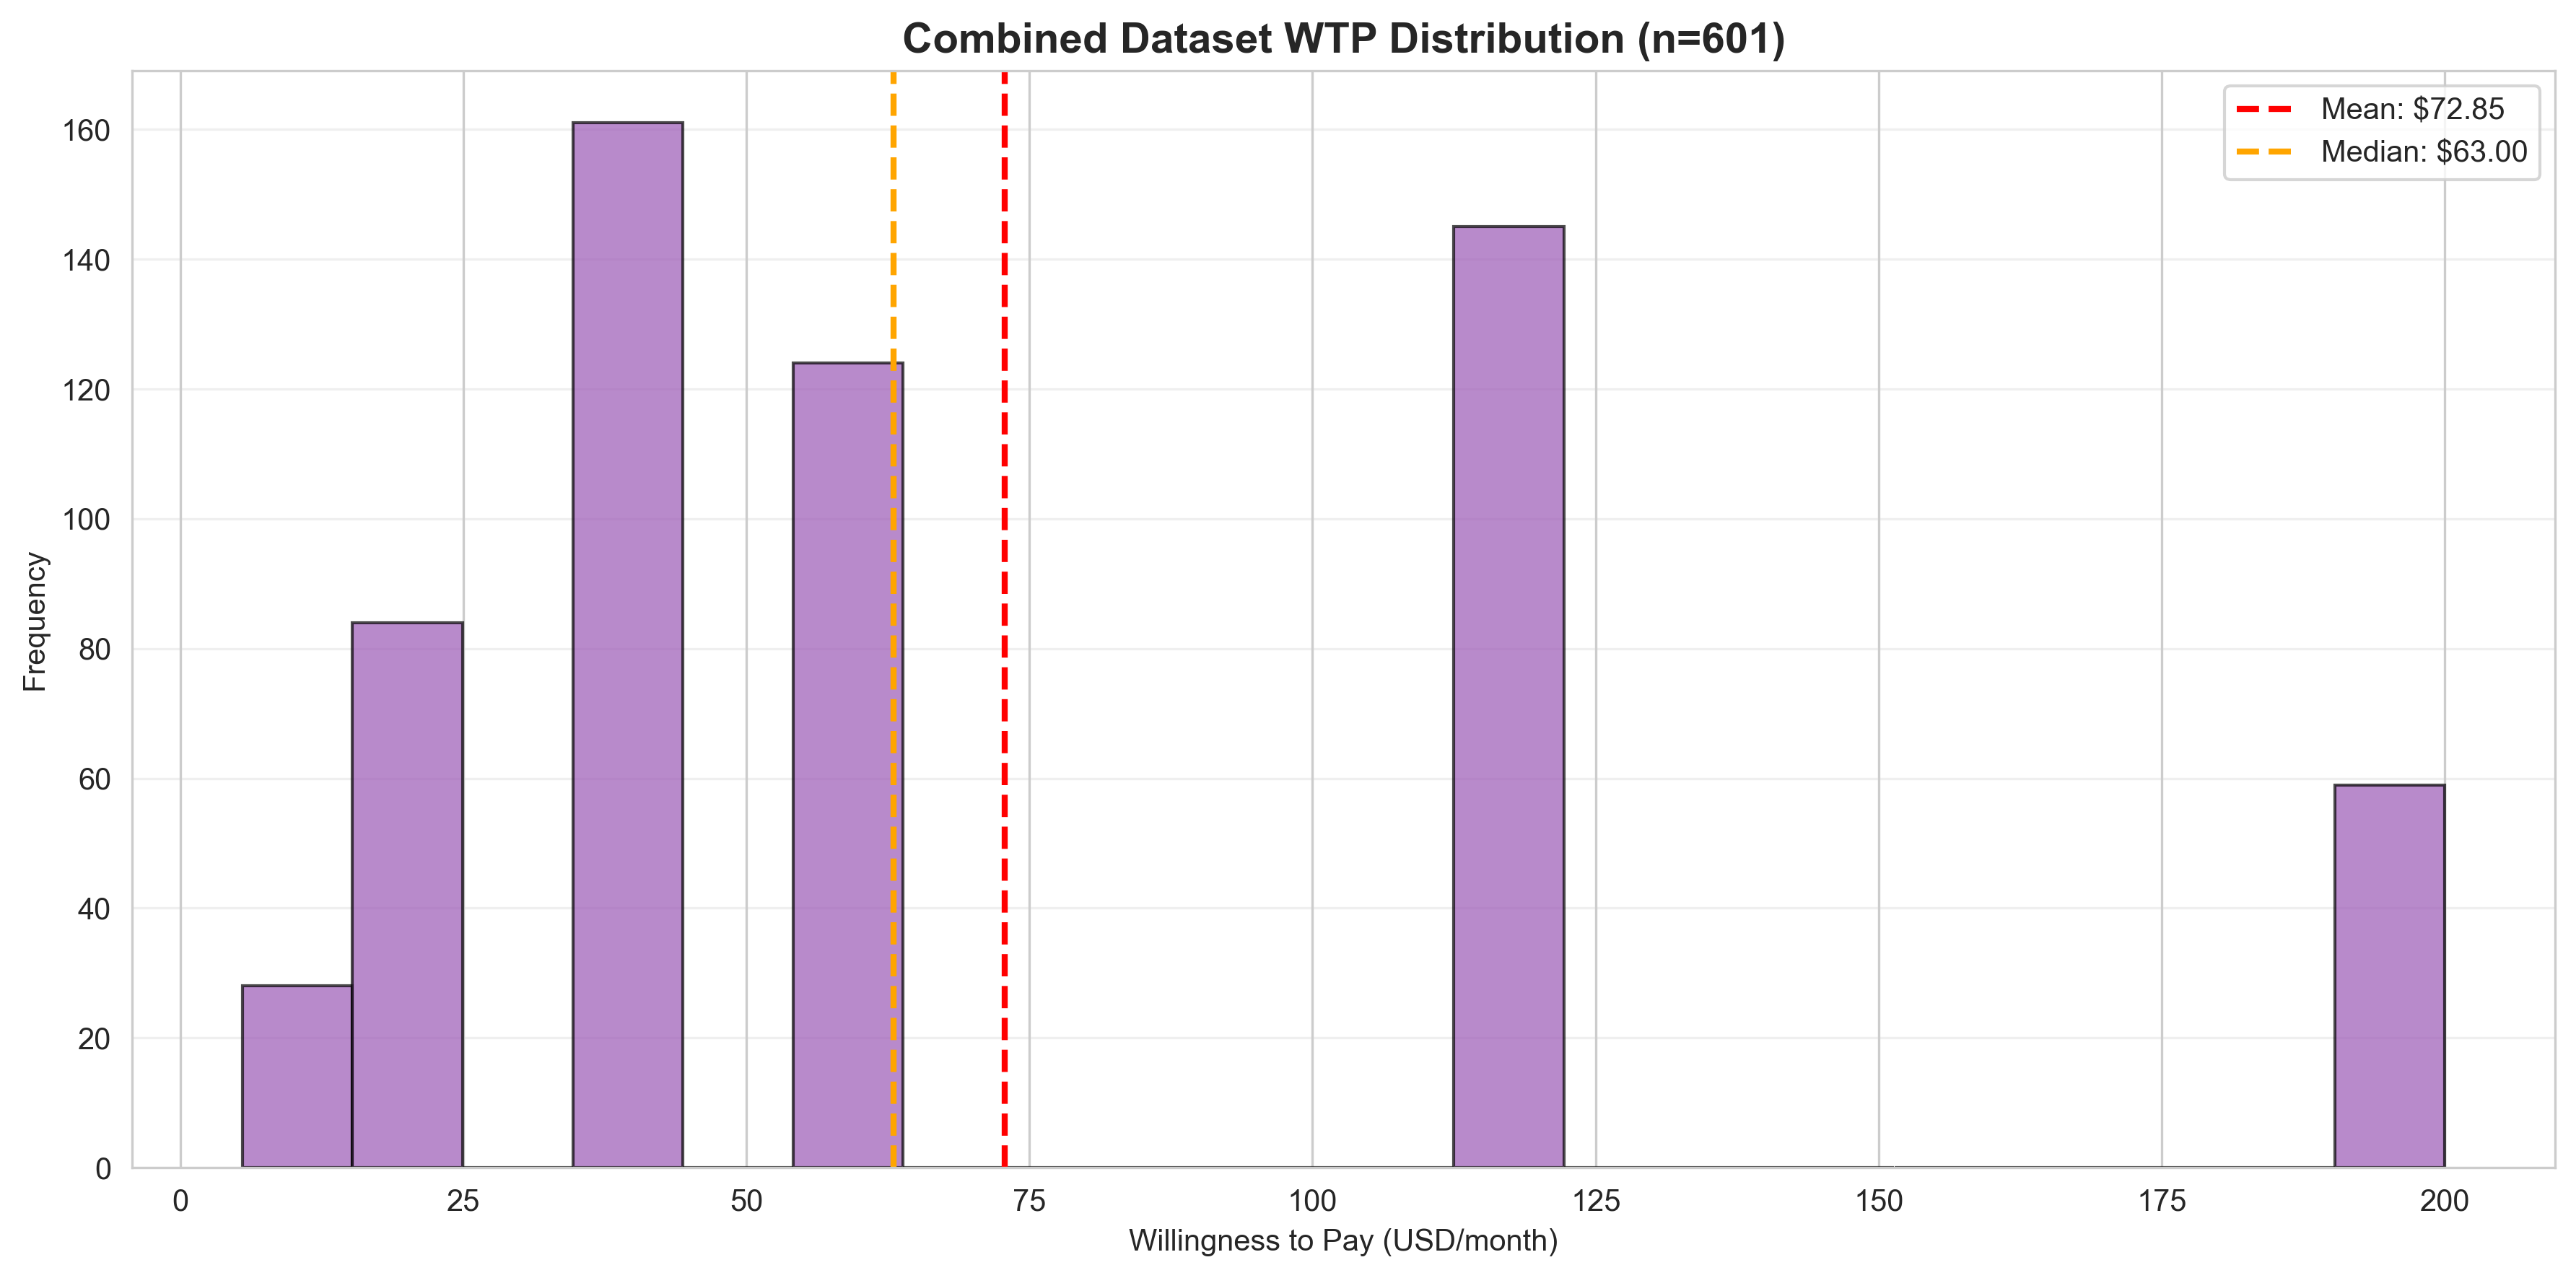
Willingness-to-pay distribution for all 601 responses. Shows clear premium market with median at $63, mean at $72.85. Right-skew indicates high-value segment opportunities.
Combined WTP by Persona
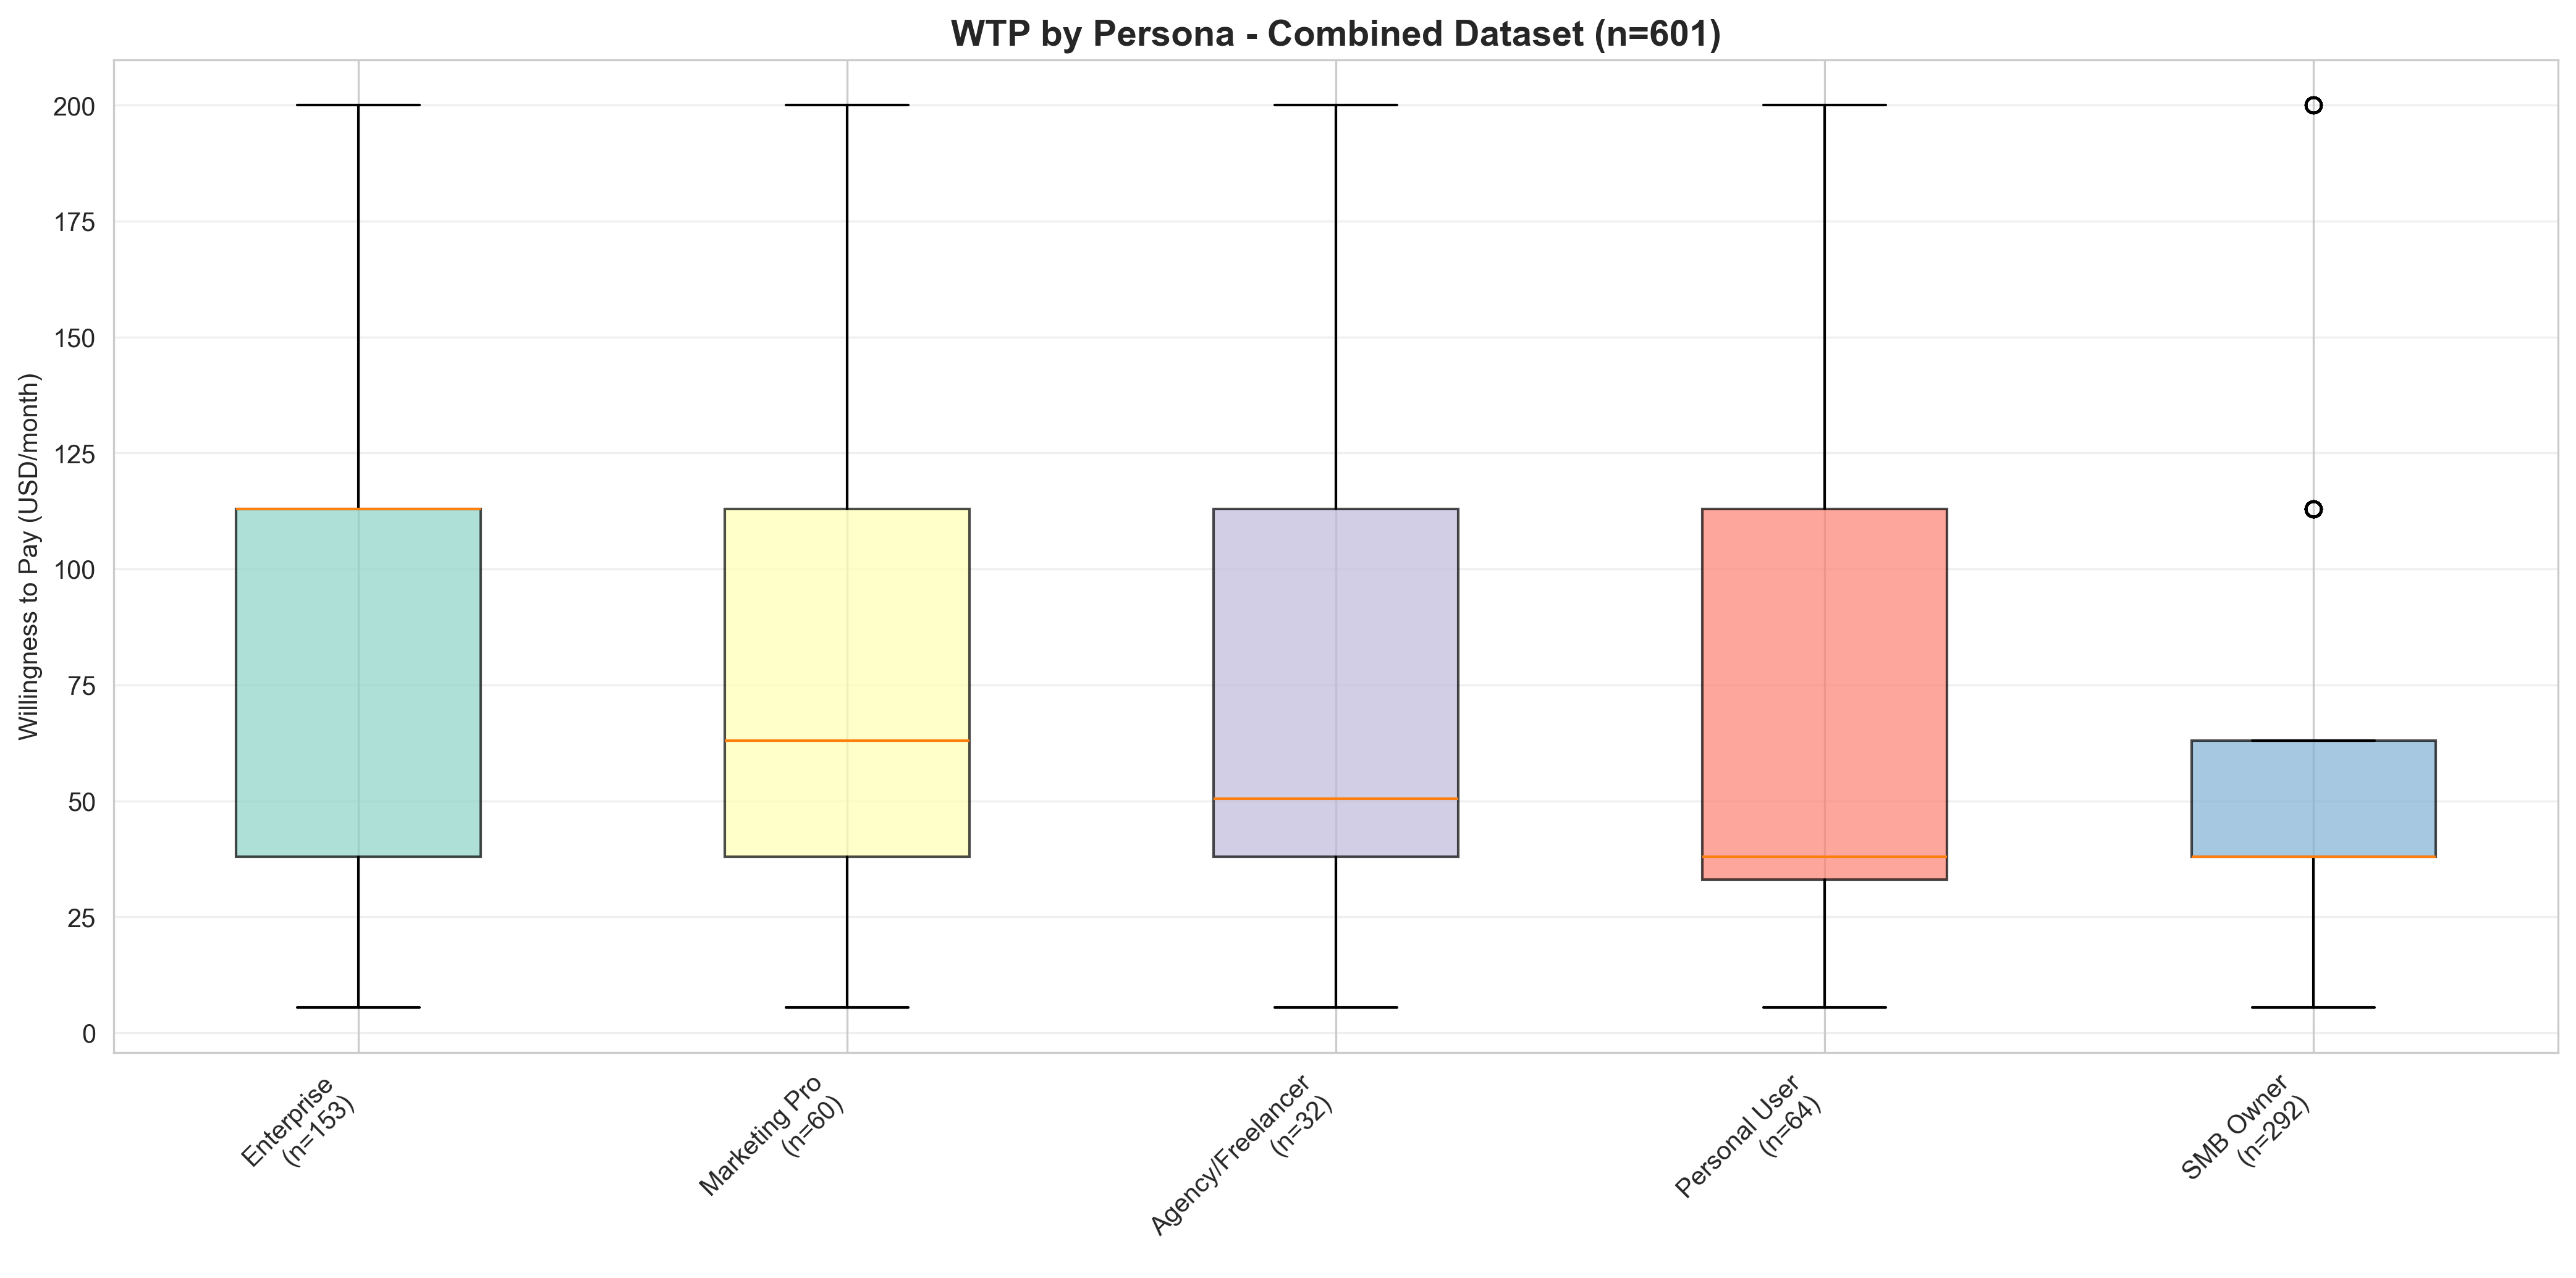
Box plots showing WTP distributions across all 5 personas with combined dataset (n=601). Enterprise leads at $91 mean, Marketing Pros at $82. Clear persona differentiation validates tiered pricing strategy.
Persona Distribution Comparison
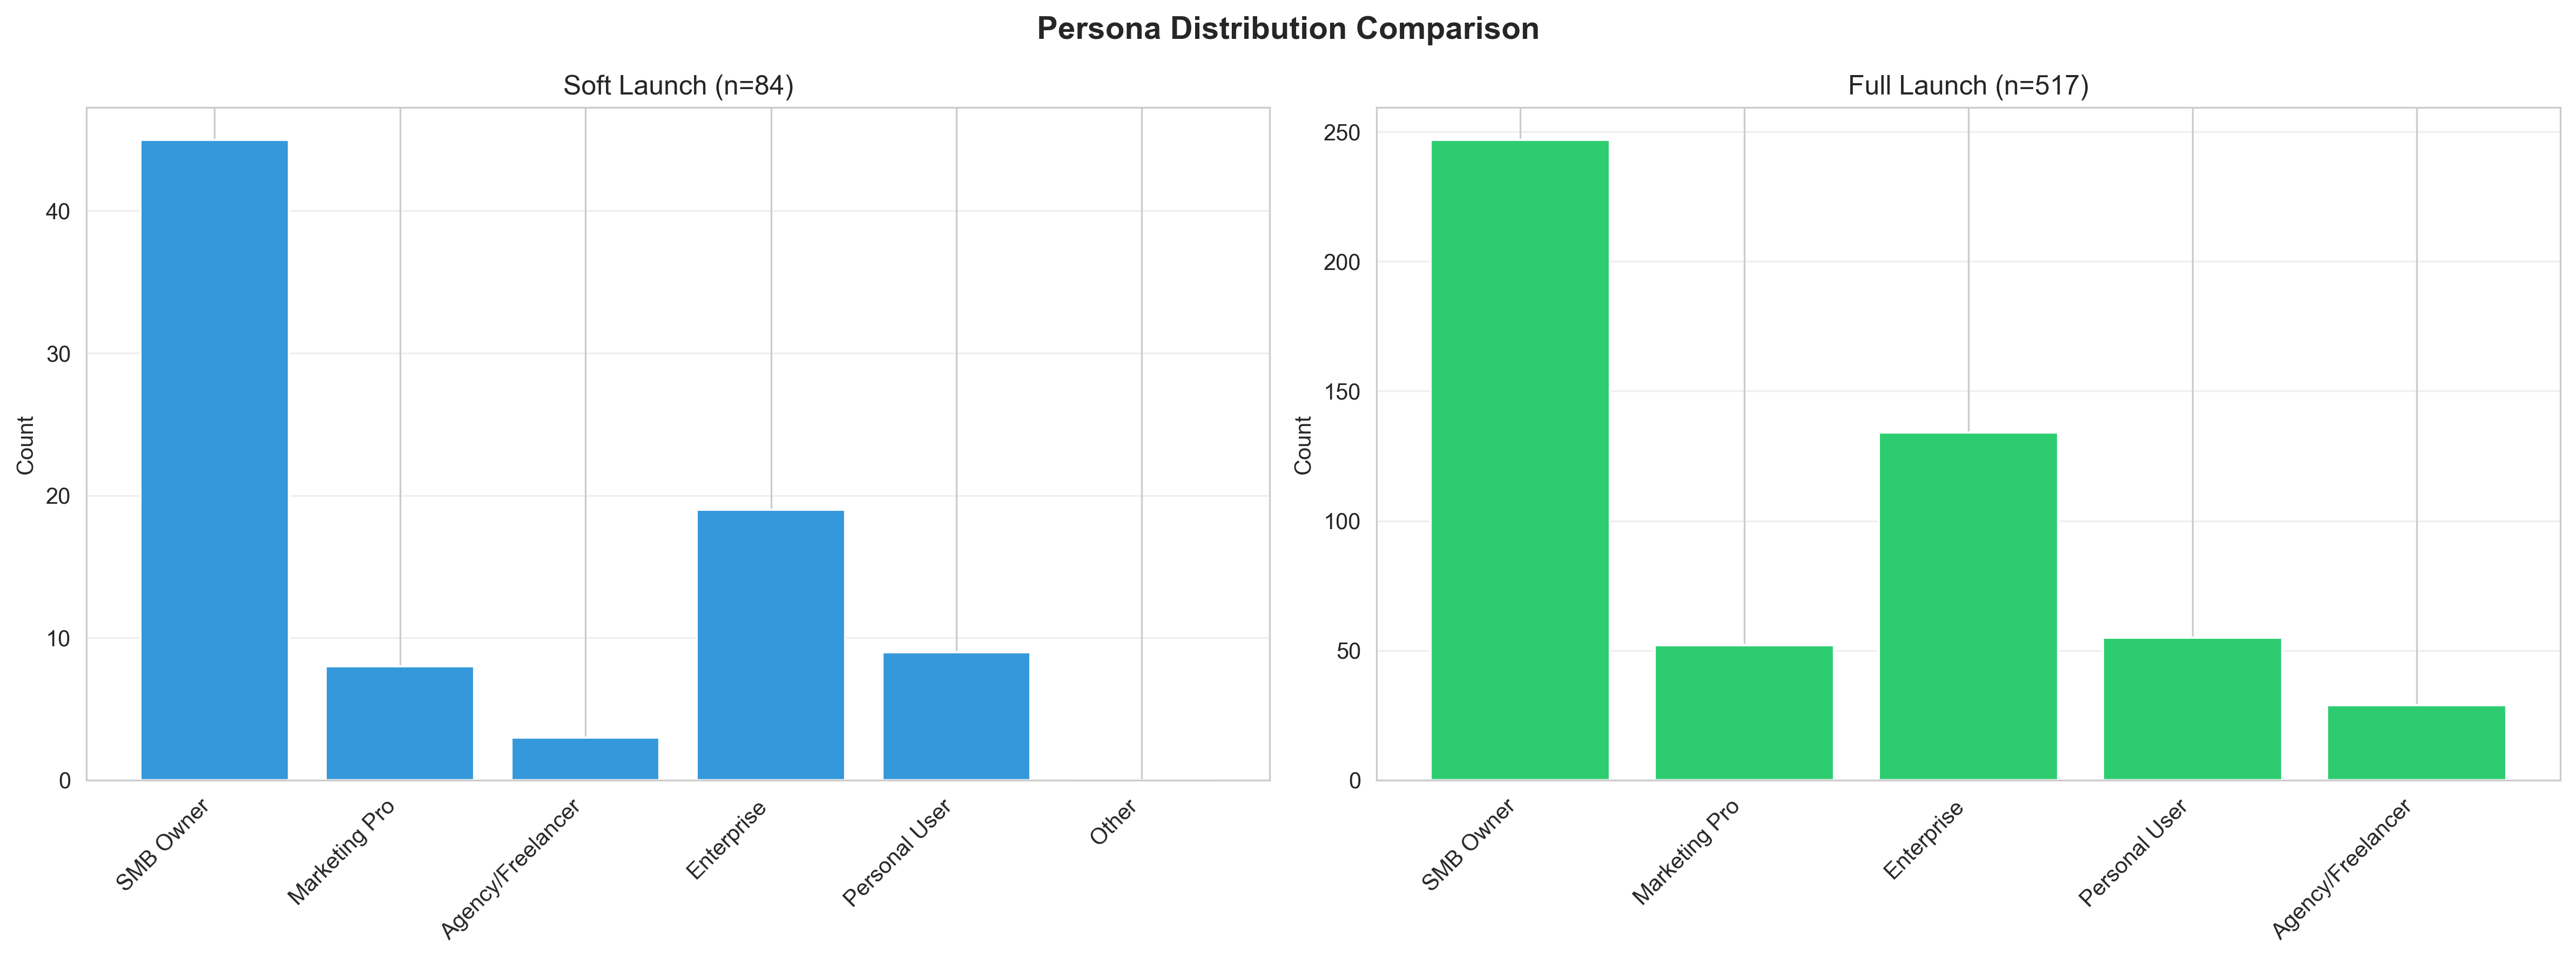
Side-by-side comparison of soft launch vs full launch persona distributions. No significant difference (χ² = 1.39, p = 0.845) confirms sample compatibility.
Budget Distribution Comparison
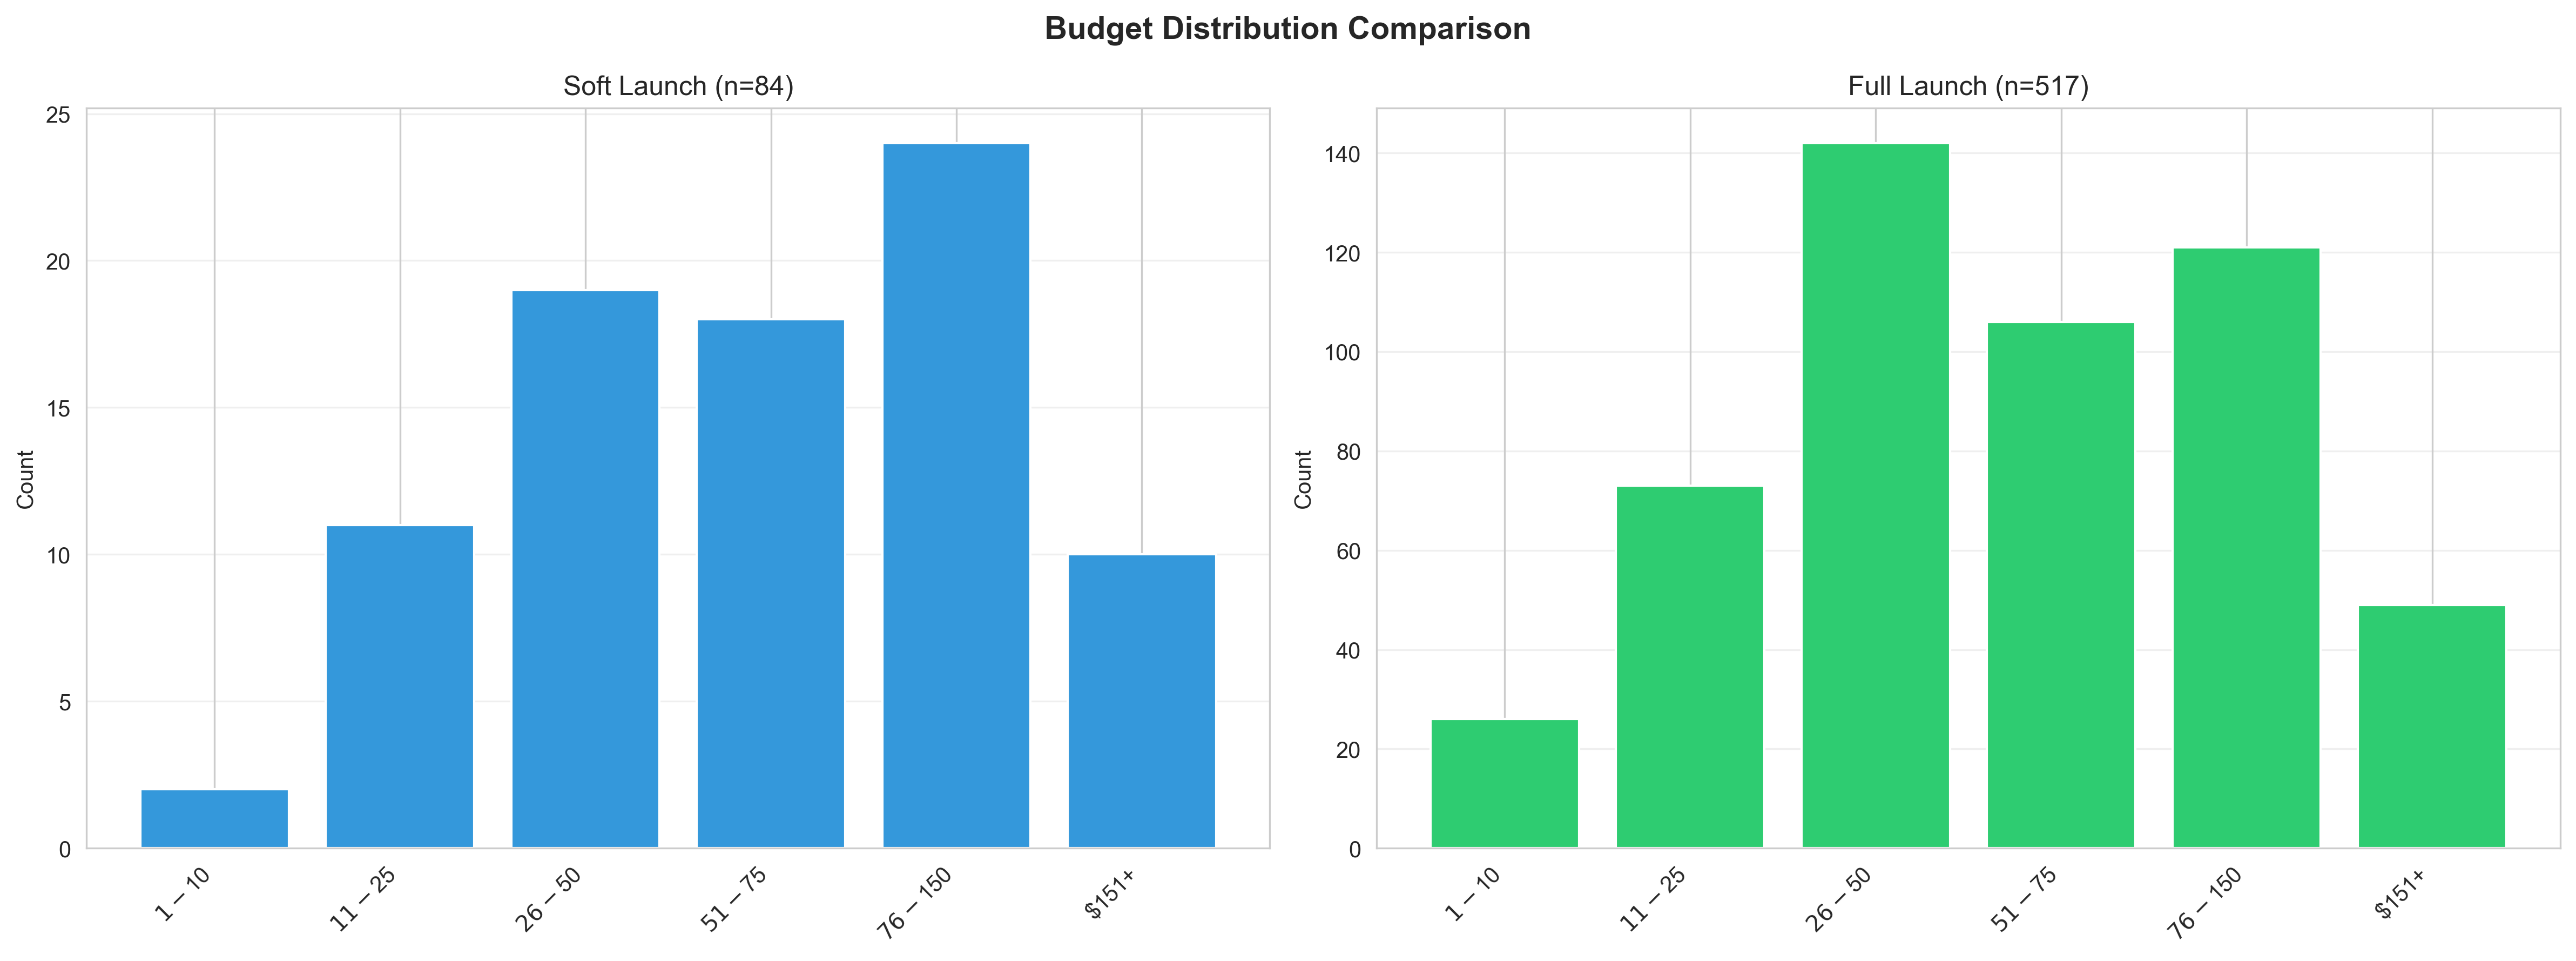
Budget tier distributions across both launches. Consistent patterns (χ² = 3.04, p = 0.694) validate combining datasets. $26-$75 range dominates both samples.
WTP Box Plot Comparison
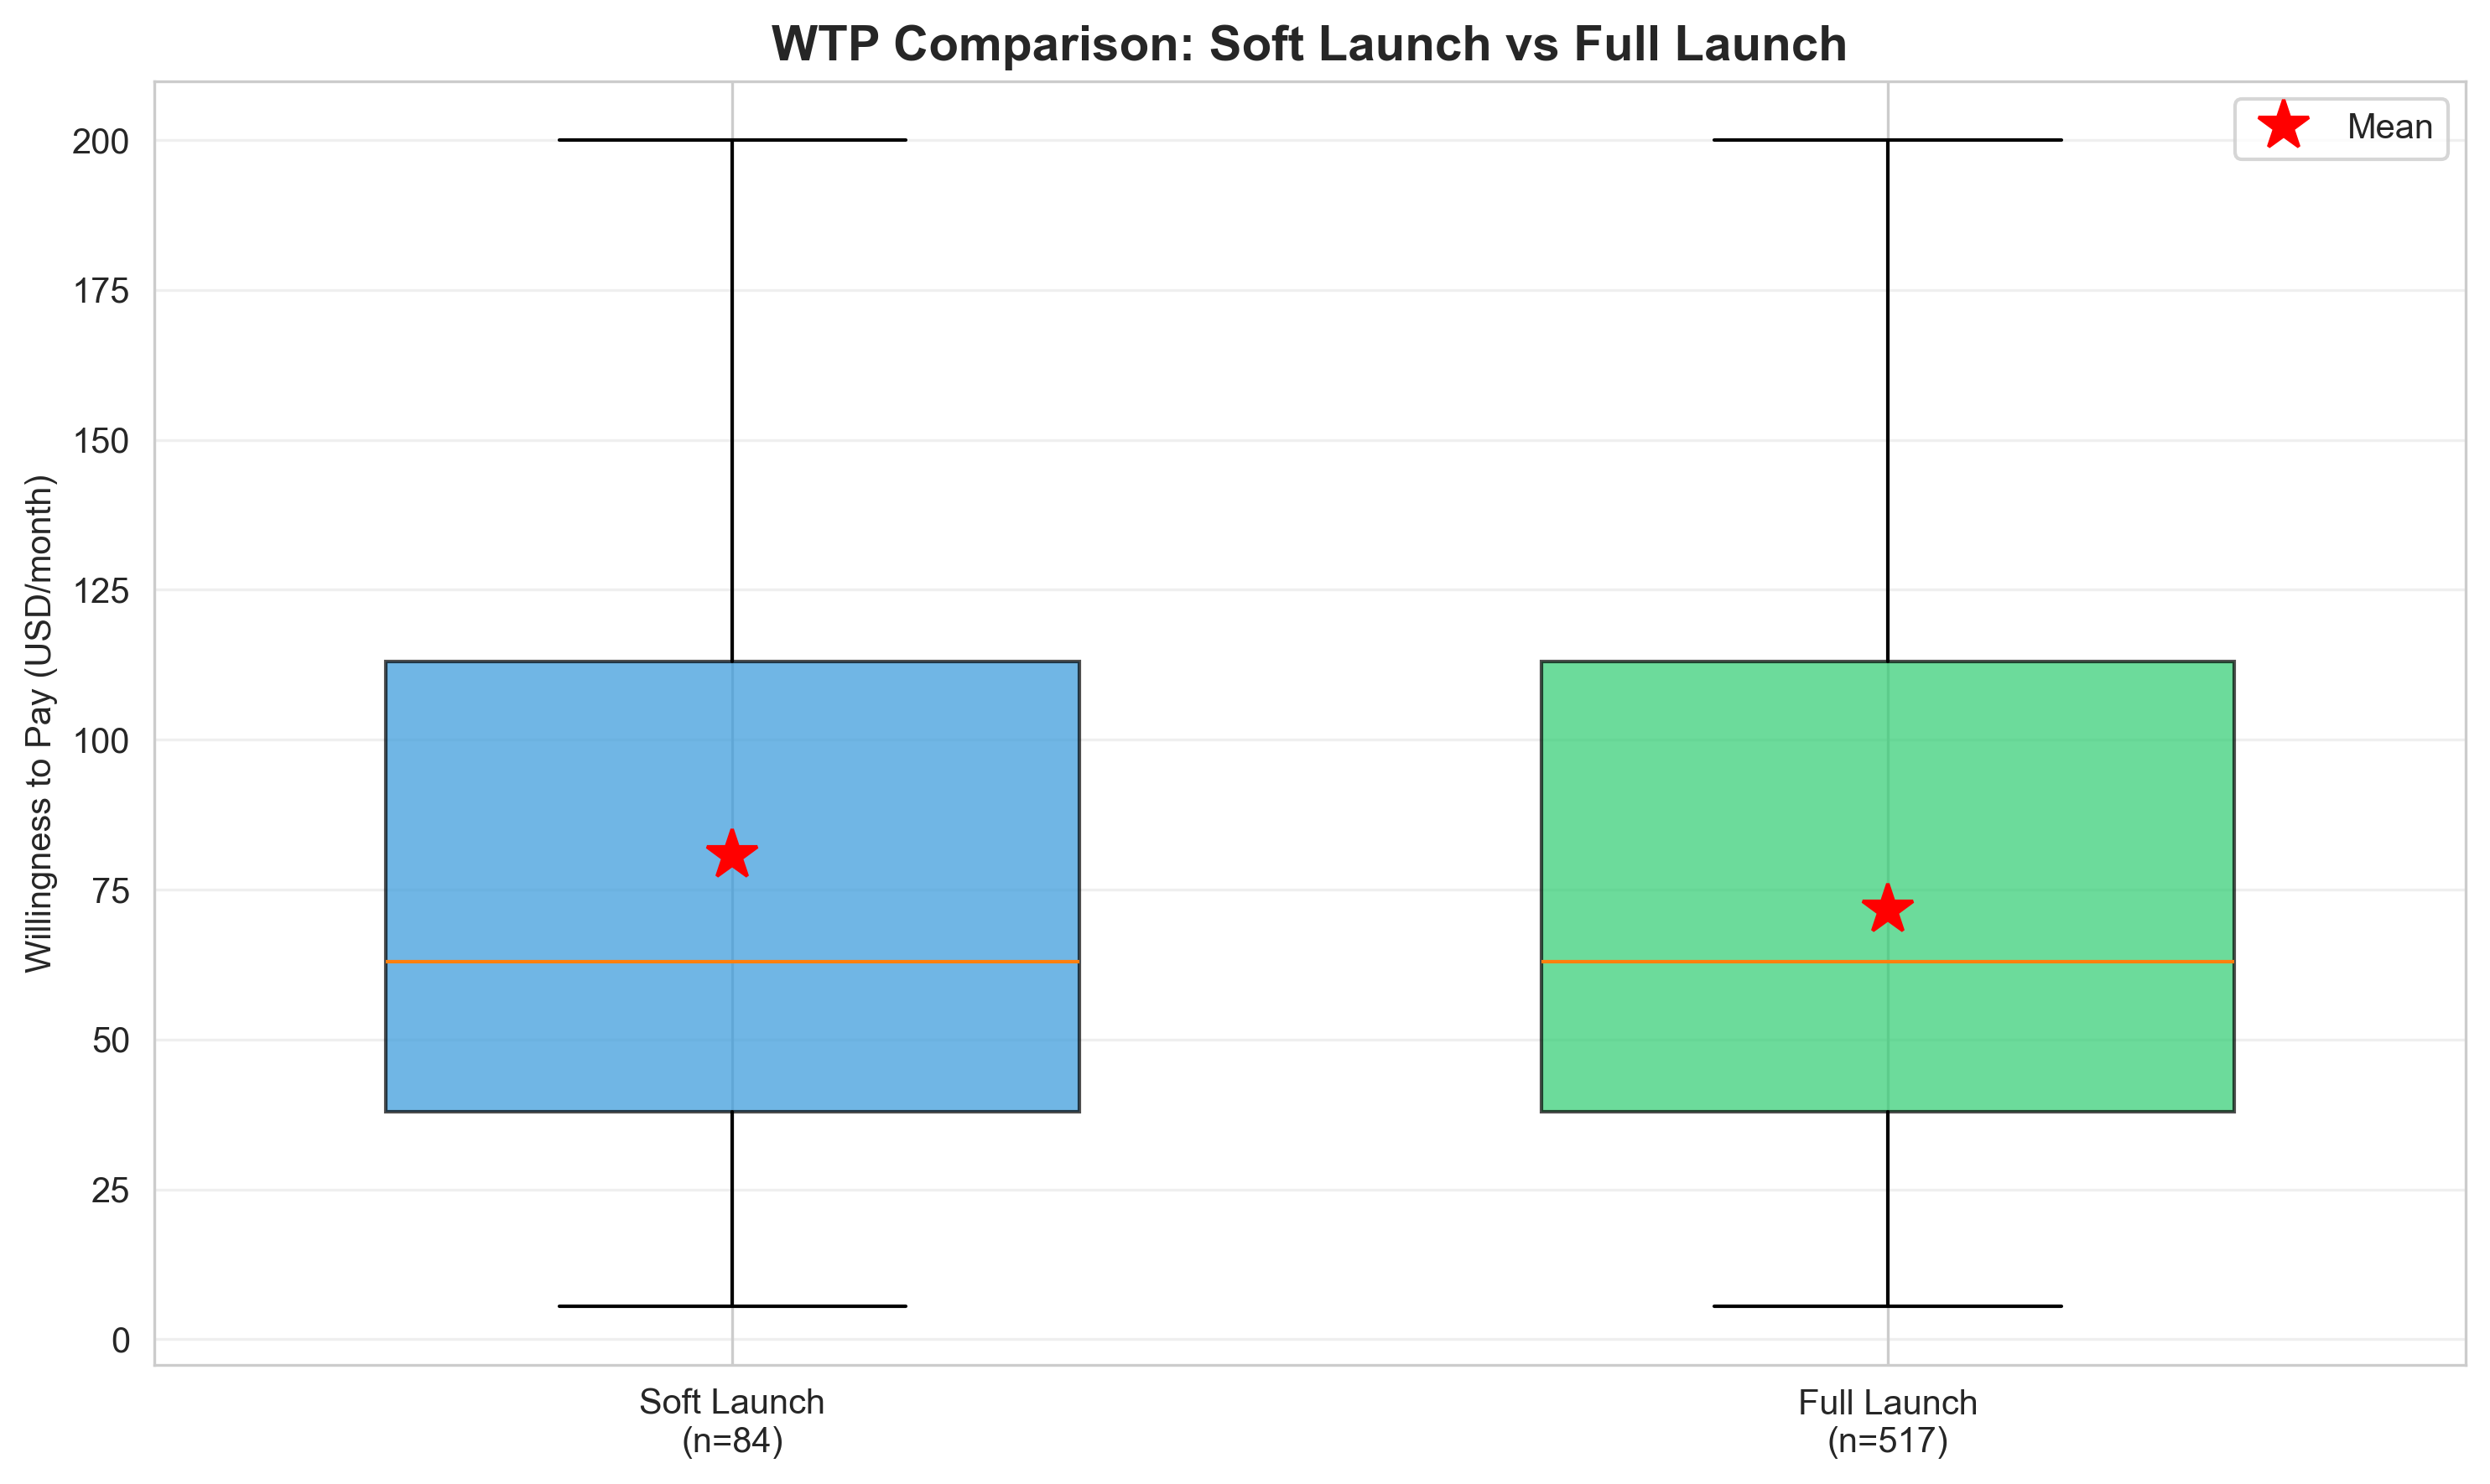
Statistical comparison of soft vs full launch WTP distributions. Overlapping quartiles and consistent medians ($63) confirm no significant difference (p = 0.155).
Technology Preference Shifts
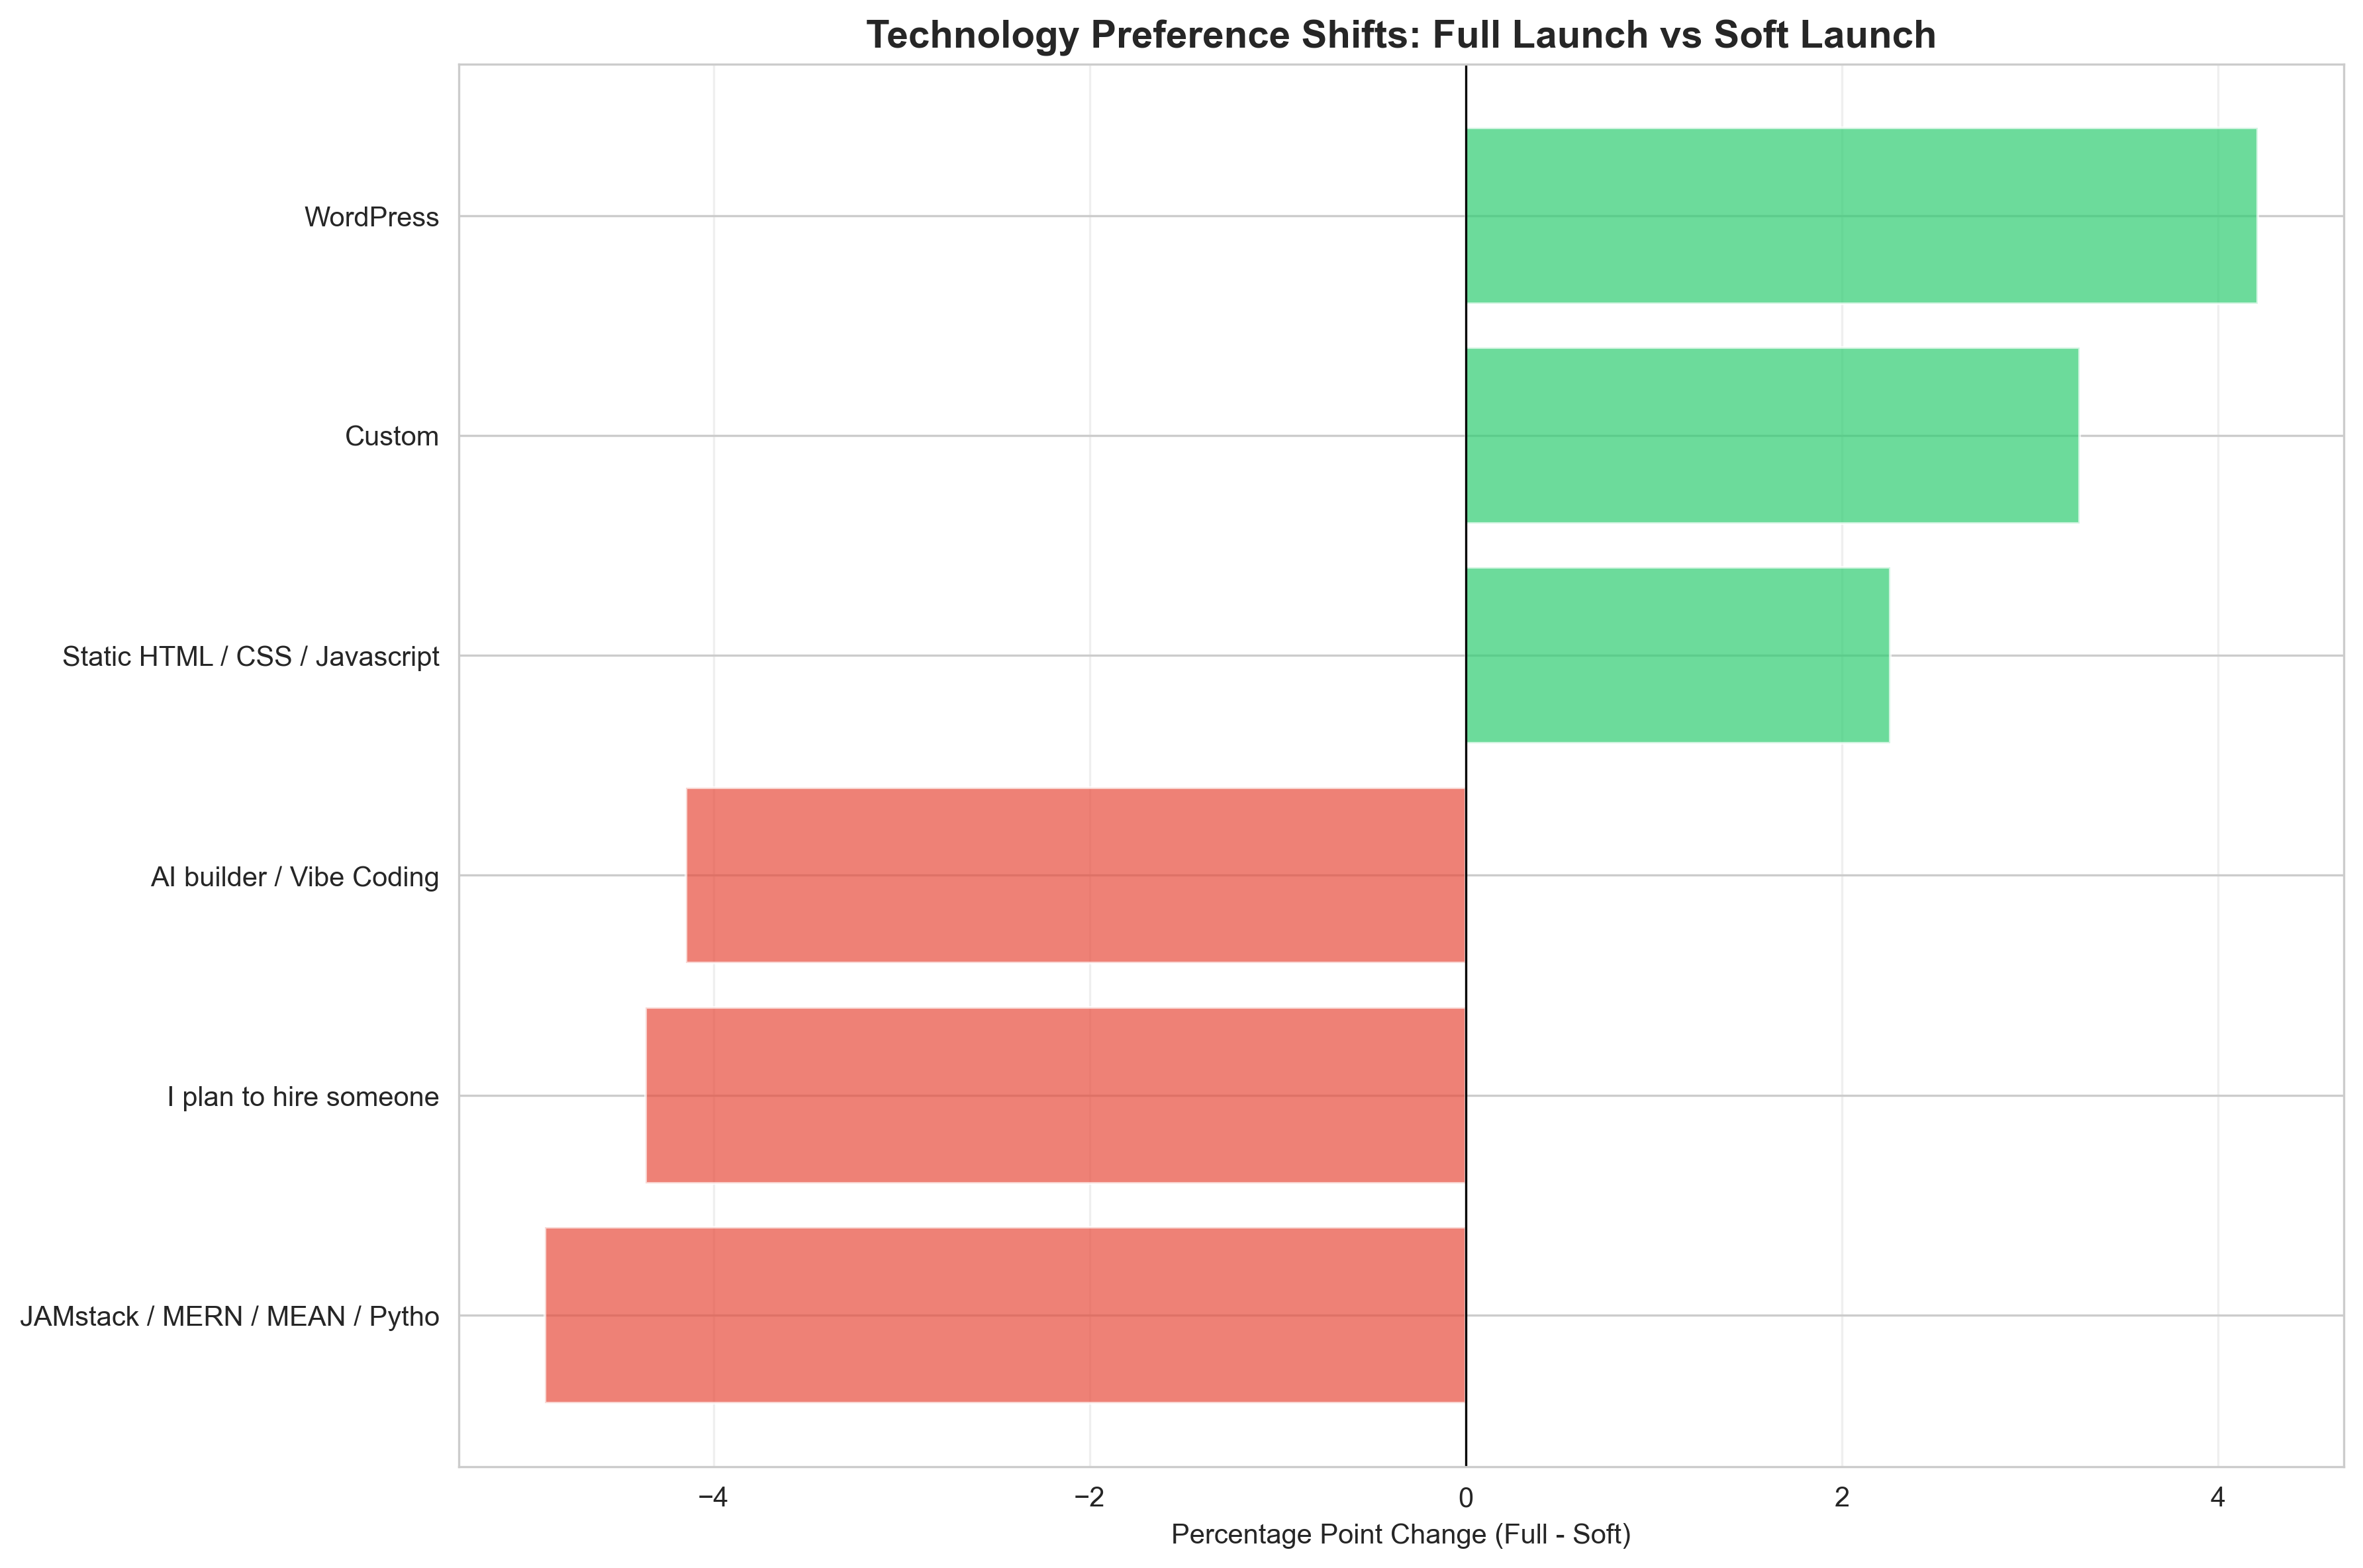
Technology platform preferences across launches. AI/Vibe Coding and modern frameworks show consistent interest. Full launch provides better representation of diverse stack preferences.
🎯 Why Use Combined Dataset (n=601)?
✓ Statistical Validity
Three independent statistical tests confirm soft launch and full launch samples come from the same population. No significant differences in demographics, budgets, or WTP.
p-values: 0.845, 0.694, 0.155 (all > 0.05)
✓ Maximum Statistical Power
601 responses provide excellent power for detecting medium effects, analyzing 5-10 segments reliably, and conducting robust subgroup analysis.
Power: >80% for r ≥ 0.15 correlations
✓ Tightest Precision
95% confidence interval narrows from ±$11.98 (soft launch) to ±$4.36 (combined), providing most reliable pricing recommendations.
Improvement: 64% tighter confidence intervals
✓ Better Representation
Larger sample provides better coverage of underrepresented personas (Marketing, Personal, Agency), ensuring all segments have n ≥ 30 for valid analysis.
Min persona n: 32 (vs 3 in soft launch)
Recommendation: Use Combined Dataset for All Decisions
The combined dataset (n=601) provides the most reliable foundation for:
- Pricing Strategy: Tightest confidence intervals for price point recommendations
- Feature Prioritization: Strongest statistical power to detect feature-WTP correlations
- Persona Targeting: All segments adequately represented (n ≥ 30)
- Market Sizing: Most accurate demographic and budget distributions
- Product Roadmap: Most comprehensive understanding of customer needs
💰 Pricing Recommendations (Based on Combined Dataset)
Recommended 4-Tier Structure (n=601 Validated)
Based on combined dataset quartiles and persona WTP patterns:
25th percentile price point. Entry features for personal sites and budget-conscious SMBs. Market coverage: 20-25%.
Median WTP confirmed across both launches. Core features + analytics + AI tools. Expected adoption: 40-50%. Primary revenue driver.
75th percentile. Advanced features, developer tools, database hosting, priority support. Target: 25-30% of market.
Premium tier for Enterprise persona (n=153, mean $91). Unlimited features, dedicated support. Target: 10-15% of market.
Pricing Strategy Confidence
With 601 responses and 95% CI of ±$4.36:
- Median ($63): True population median likely between $58.64 - $67.36
- Mean ($72.85): True population mean likely between $68.49 - $77.20
- Quartiles: Stable across both launches (Q1: $38, Q3: $113)
🚀 Next Steps
Implementation Roadmap
- Finalize pricing: Use recommended 4-tier structure based on combined dataset quartiles
- Feature bundling: Assign features to tiers based on combined dataset correlations
- Persona targeting: Build marketing campaigns for Enterprise (n=153) and Marketing (n=60) high-value segments
- A/B testing: Test price points within confidence intervals ($63 ± $5)
- Monitor adoption: Track actual tier selection vs predicted 40-50% Professional adoption
Additional Resources
- Comparison Analysis: Detailed statistical validation of sample compatibility
- Soft Launch Results (n=84): Initial validation study results
- Full Launch Results (n=517): Expanded dataset with enhanced statistical power
- Combined Data Files:
combined-data.json,combined-responses.json