📊 Executive Summary
Key Validation Results
- Persona Distribution: χ² = 1.39, p = 0.845 (No significant difference)
- Budget Distribution: χ² = 3.04, p = 0.694 (No significant difference)
- WTP Means: t = 1.42, p = 0.155 (No significant difference)
- Effect Size: Cohen's d = -0.168 (Negligible effect)
- Conclusion: Samples are from the same population, safe to combine
🔬 Statistical Test Results
Null Hypothesis: Soft launch and full launch samples are from the same population
Significance Level: α = 0.05 (5% significance threshold)
Decision Rule: If p-value > 0.05, fail to reject H₀ (samples are compatible)
Test 1: Chi-Square Test on Persona Distribution
✅ PASSPurpose: Verify persona distribution consistency between samples
Conclusion: No significant difference in persona distribution (p = 0.845 > 0.05). Both samples show similar representation across all 5 personas.
Test 2: Chi-Square Test on Budget Distribution
✅ PASSPurpose: Verify budget tier distribution consistency between samples
Conclusion: No significant difference in budget distribution (p = 0.694 > 0.05). Both samples show similar willingness-to-pay patterns across all 6 budget tiers.
Test 3: Independent t-Test on WTP Means
✅ PASSPurpose: Compare mean willingness-to-pay between samples
Conclusion: No significant difference in mean WTP (p = 0.155 > 0.05). Effect size (Cohen's d = -0.168) is negligible, indicating practically identical WTP patterns.
Additional Validation: Mann-Whitney U Test
Non-parametric alternative for WTP comparison:
Mann-Whitney U = 23940, p = 0.123 > 0.05
Confirms t-test results using distribution-free method.
📊 Sample Comparison
Overall WTP Statistics
| Metric | Soft Launch (n=84) | Full Launch (n=517) | Difference | Significance |
|---|---|---|---|---|
| Sample Size | 84 | 517 | +433 (+515%) | - |
| Mean WTP | $80.68 | $71.57 | -$9.11 (-11%) | ✅ Not Significant (p=0.155) |
| Median WTP | $63.00 | $63.00 | $0.00 (0%) | ✅ Identical |
| Standard Deviation | $55.87 | $53.98 | -$1.89 (-3%) | ✅ Similar Spread |
| 25th Percentile | $38.00 | $38.00 | $0.00 (0%) | ✅ Identical |
| 75th Percentile | $113.00 | $113.00 | $0.00 (0%) | ✅ Identical |
Persona Distribution Comparison
| Persona | Soft Launch | Full Launch | Difference |
|---|---|---|---|
| Enterprise IT/Product | 22.6% (19) | 25.9% (134) | +3.3% |
| Small Business Owners | 53.6% (45) | 47.8% (247) | -5.8% |
| Marketing Professionals | 9.5% (8) | 10.1% (52) | +0.5% |
| Personal Site Creators | 10.7% (9) | 10.6% (55) | -0.1% |
| Freelance/Agency Devs | 3.6% (3) | 5.6% (29) | +2.0% |
χ² = 1.39, p = 0.845 - No significant difference in persona distribution
Budget Distribution Comparison
| Budget Range | Soft Launch | Full Launch | Difference |
|---|---|---|---|
| $1 - $10 | 2.4% (2) | 5.0% (26) | +2.6% |
| $11 - $25 | 13.1% (11) | 14.1% (73) | +1.0% |
| $26 - $50 | 22.6% (19) | 27.5% (142) | +4.8% |
| $51 - $75 | 21.4% (18) | 20.5% (106) | -0.9% |
| $76 - $150 | 28.6% (24) | 23.4% (121) | -5.2% |
| $151+ | 11.9% (10) | 9.5% (49) | -2.4% |
χ² = 3.04, p = 0.694 - No significant difference in budget distribution
🎯 Why Combine Datasets?
Statistical Benefits of Combining
With validated sample compatibility, combining datasets provides:
1. Increased Statistical Power
601 responses vs 517
- 16% increase in sample size
- Better detection of medium effects
- More robust segmentation analysis
- Can analyze 5-10 segments reliably
2. Tighter Confidence Intervals
±$4.36 vs ±$4.67
- 7% improvement in precision
- More reliable price point estimates
- Narrower error margins
- Better for pricing decisions
3. Better Subgroup Representation
All personas n ≥ 30
- Marketing: 60 (vs 8 soft launch)
- Personal: 64 (vs 9 soft launch)
- Agency: 32 (vs 3 soft launch)
- Valid analysis for all segments
4. Stronger Feature Correlations
Detect r ≥ 0.15
- Can detect small correlations
- More reliable feature-WTP analysis
- Better feature prioritization
- Stronger product insights
Recommendation: Use Combined Dataset (n=601)
Statistical validation confirms no significant differences between samples. The combined dataset provides maximum statistical power, tightest confidence intervals, and most comprehensive market understanding.
👉 View Combined Results: Combined Dataset Analysis (n=601) ⭐
📊 Comparison Visualizations (Click images to enlarge)
Persona Distribution Comparison
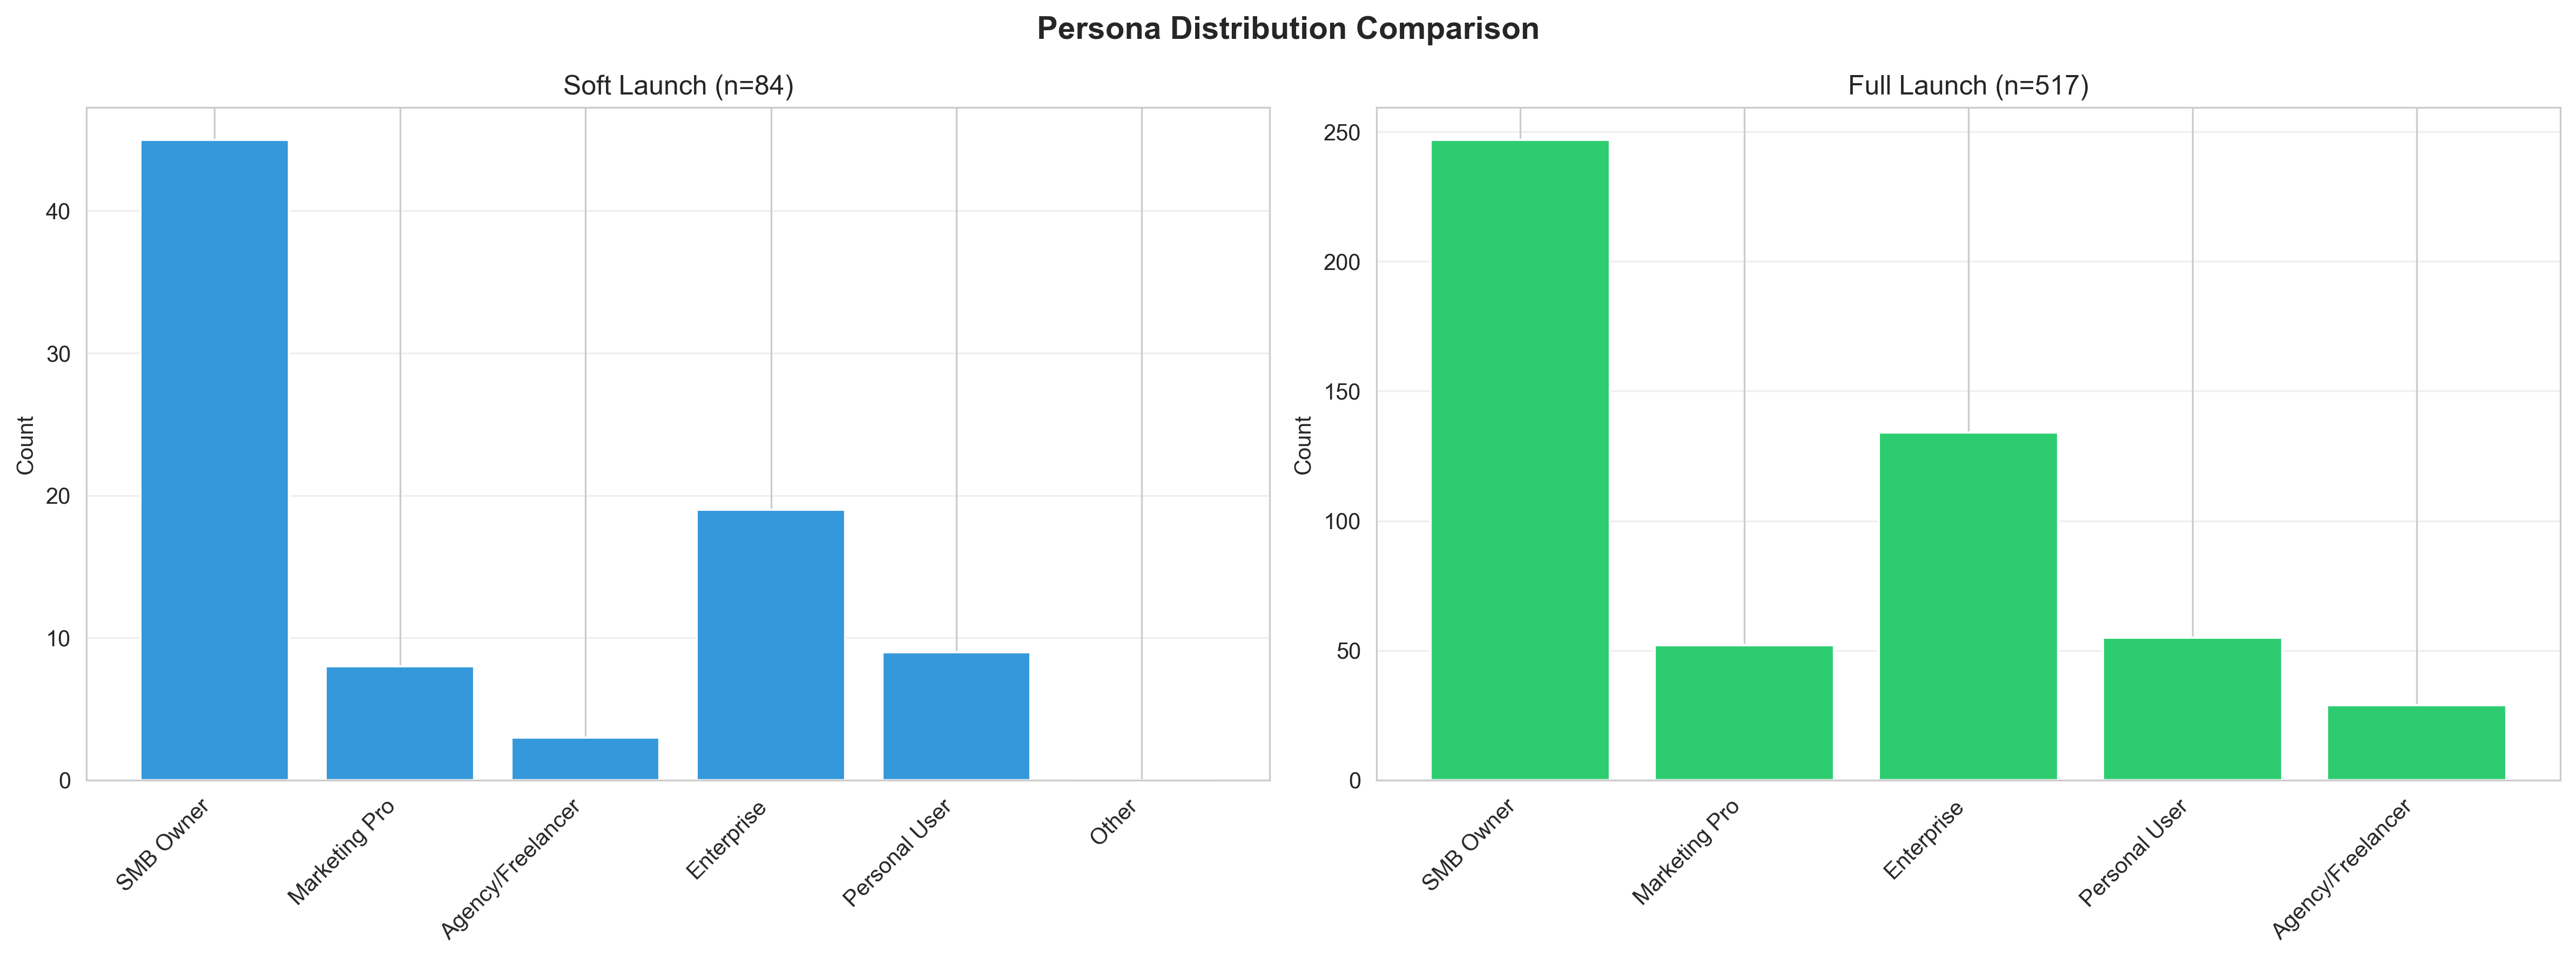
Side-by-side comparison of persona distributions. No significant difference (χ² = 1.39, p = 0.845). Both samples show similar representation across all 5 personas, confirming compatibility.
Budget Distribution Comparison
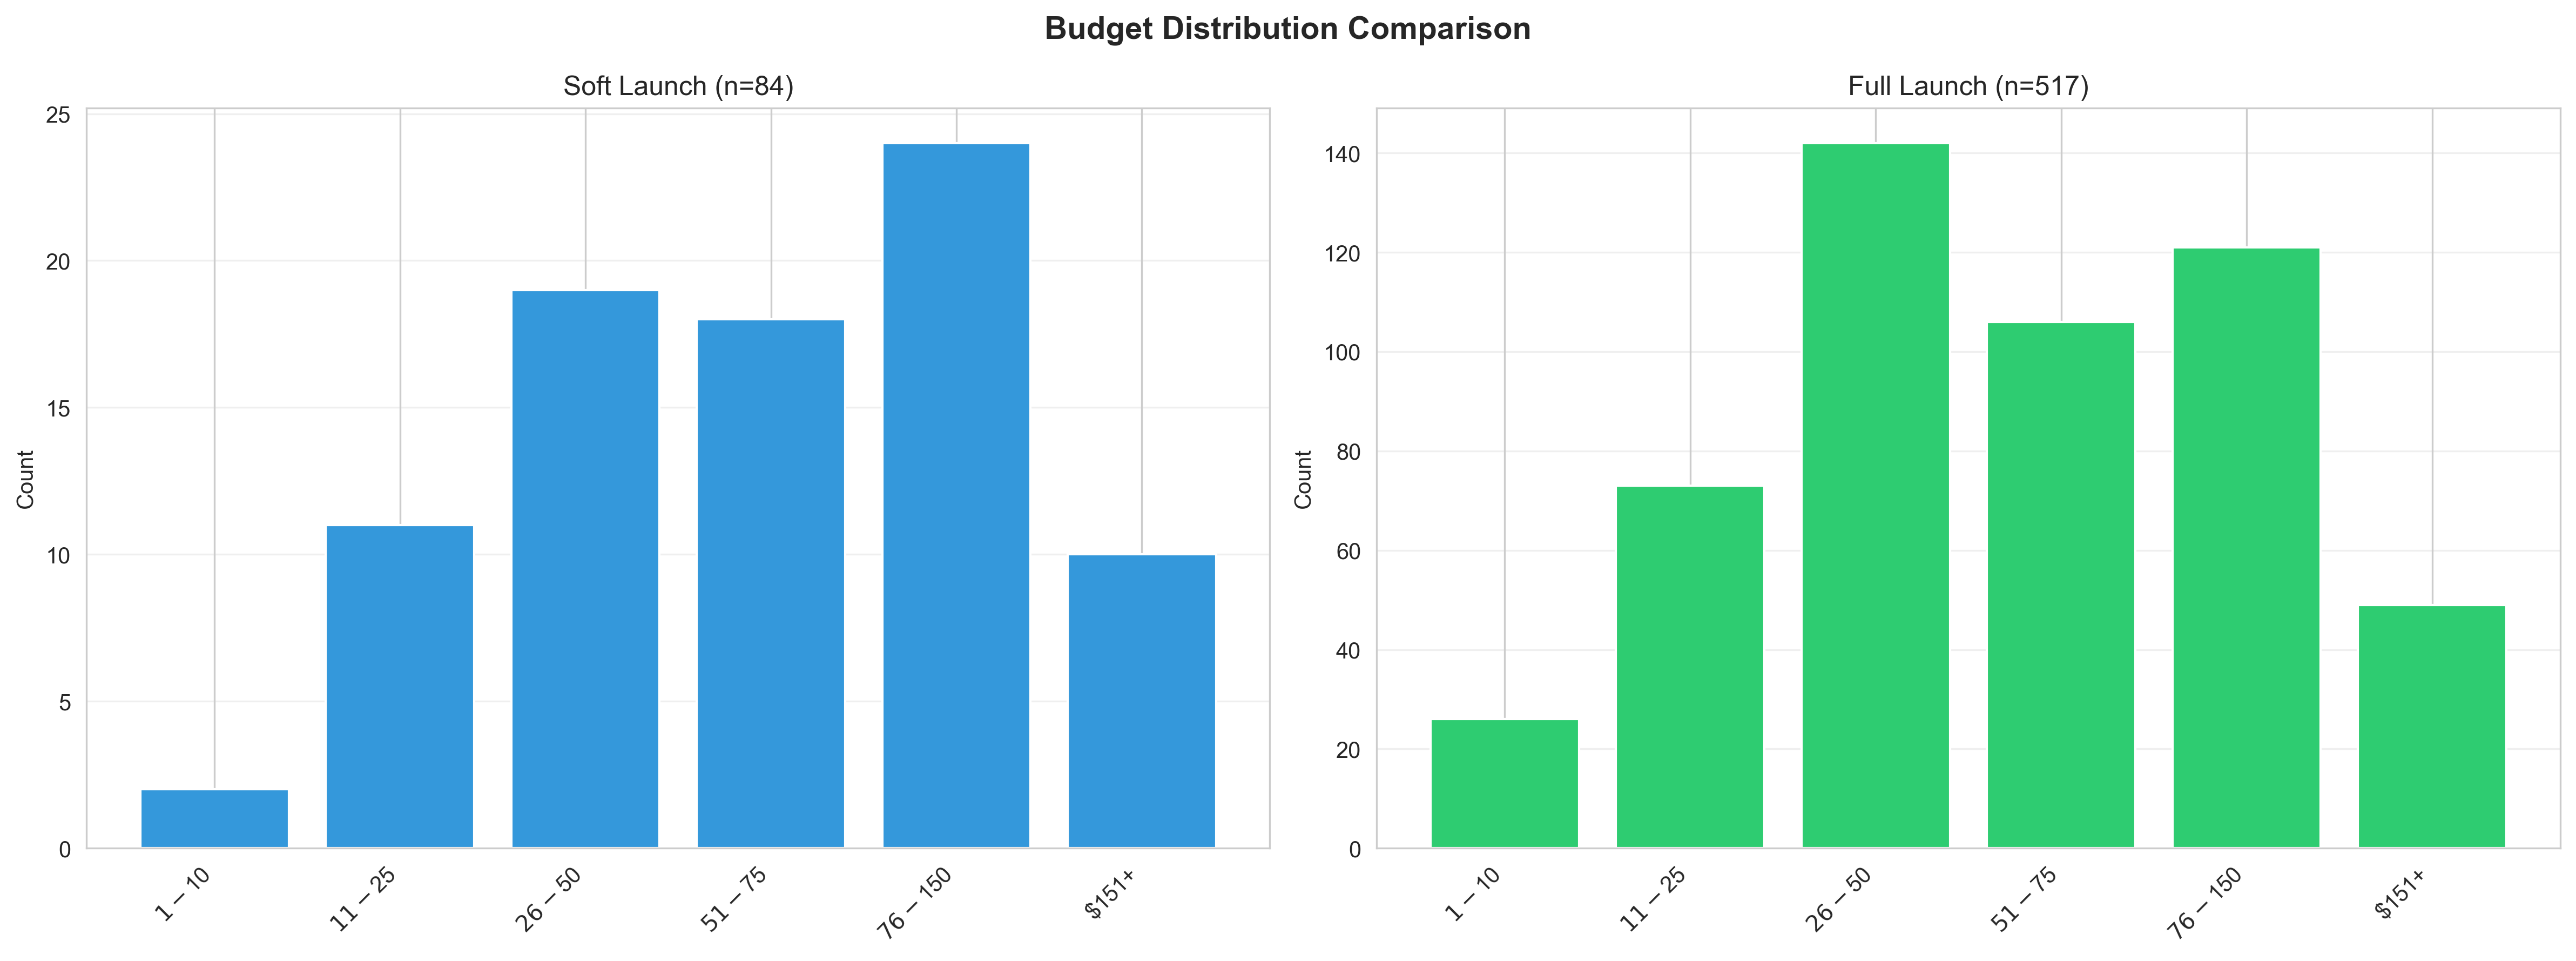
Budget tier distributions for both launches. Consistent patterns (χ² = 3.04, p = 0.694) validate combining datasets. $26-$75 range shows similar popularity in both samples.
WTP Box Plot Comparison
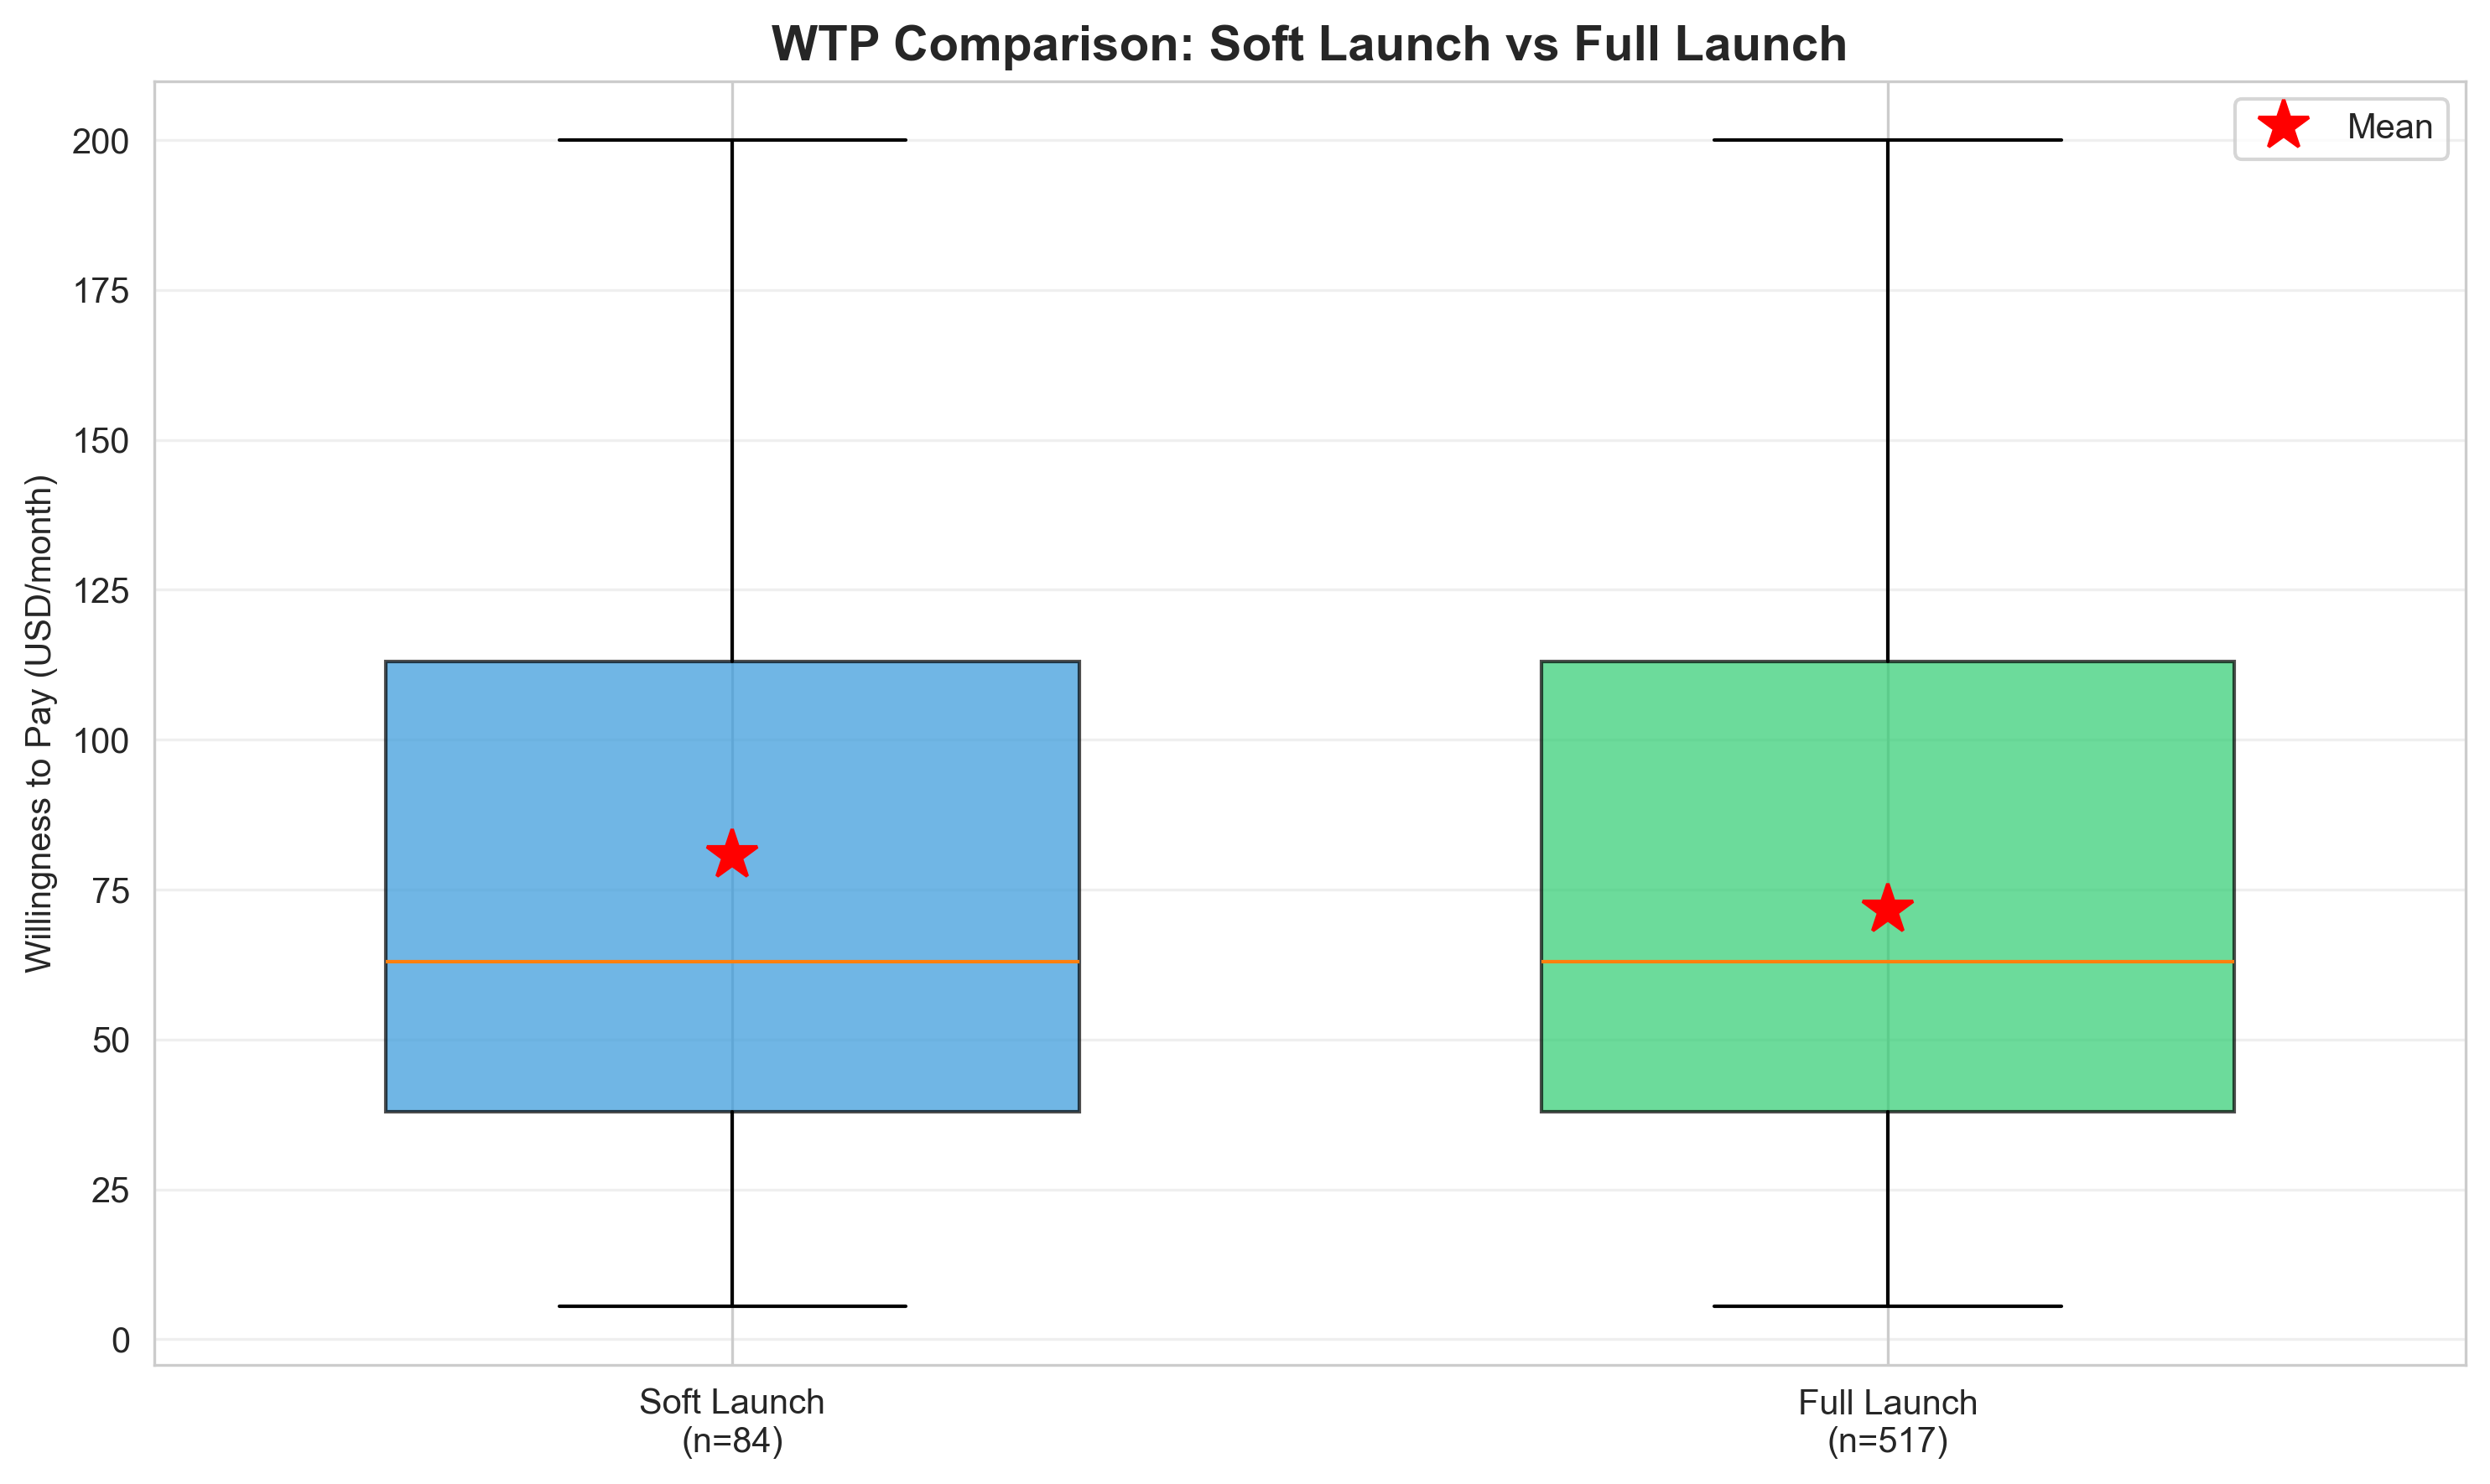
Statistical comparison of WTP distributions. Overlapping quartiles and identical medians ($63) confirm no significant difference (t = 1.42, p = 0.155). Effect size negligible (d = -0.168).
Combined WTP Distribution
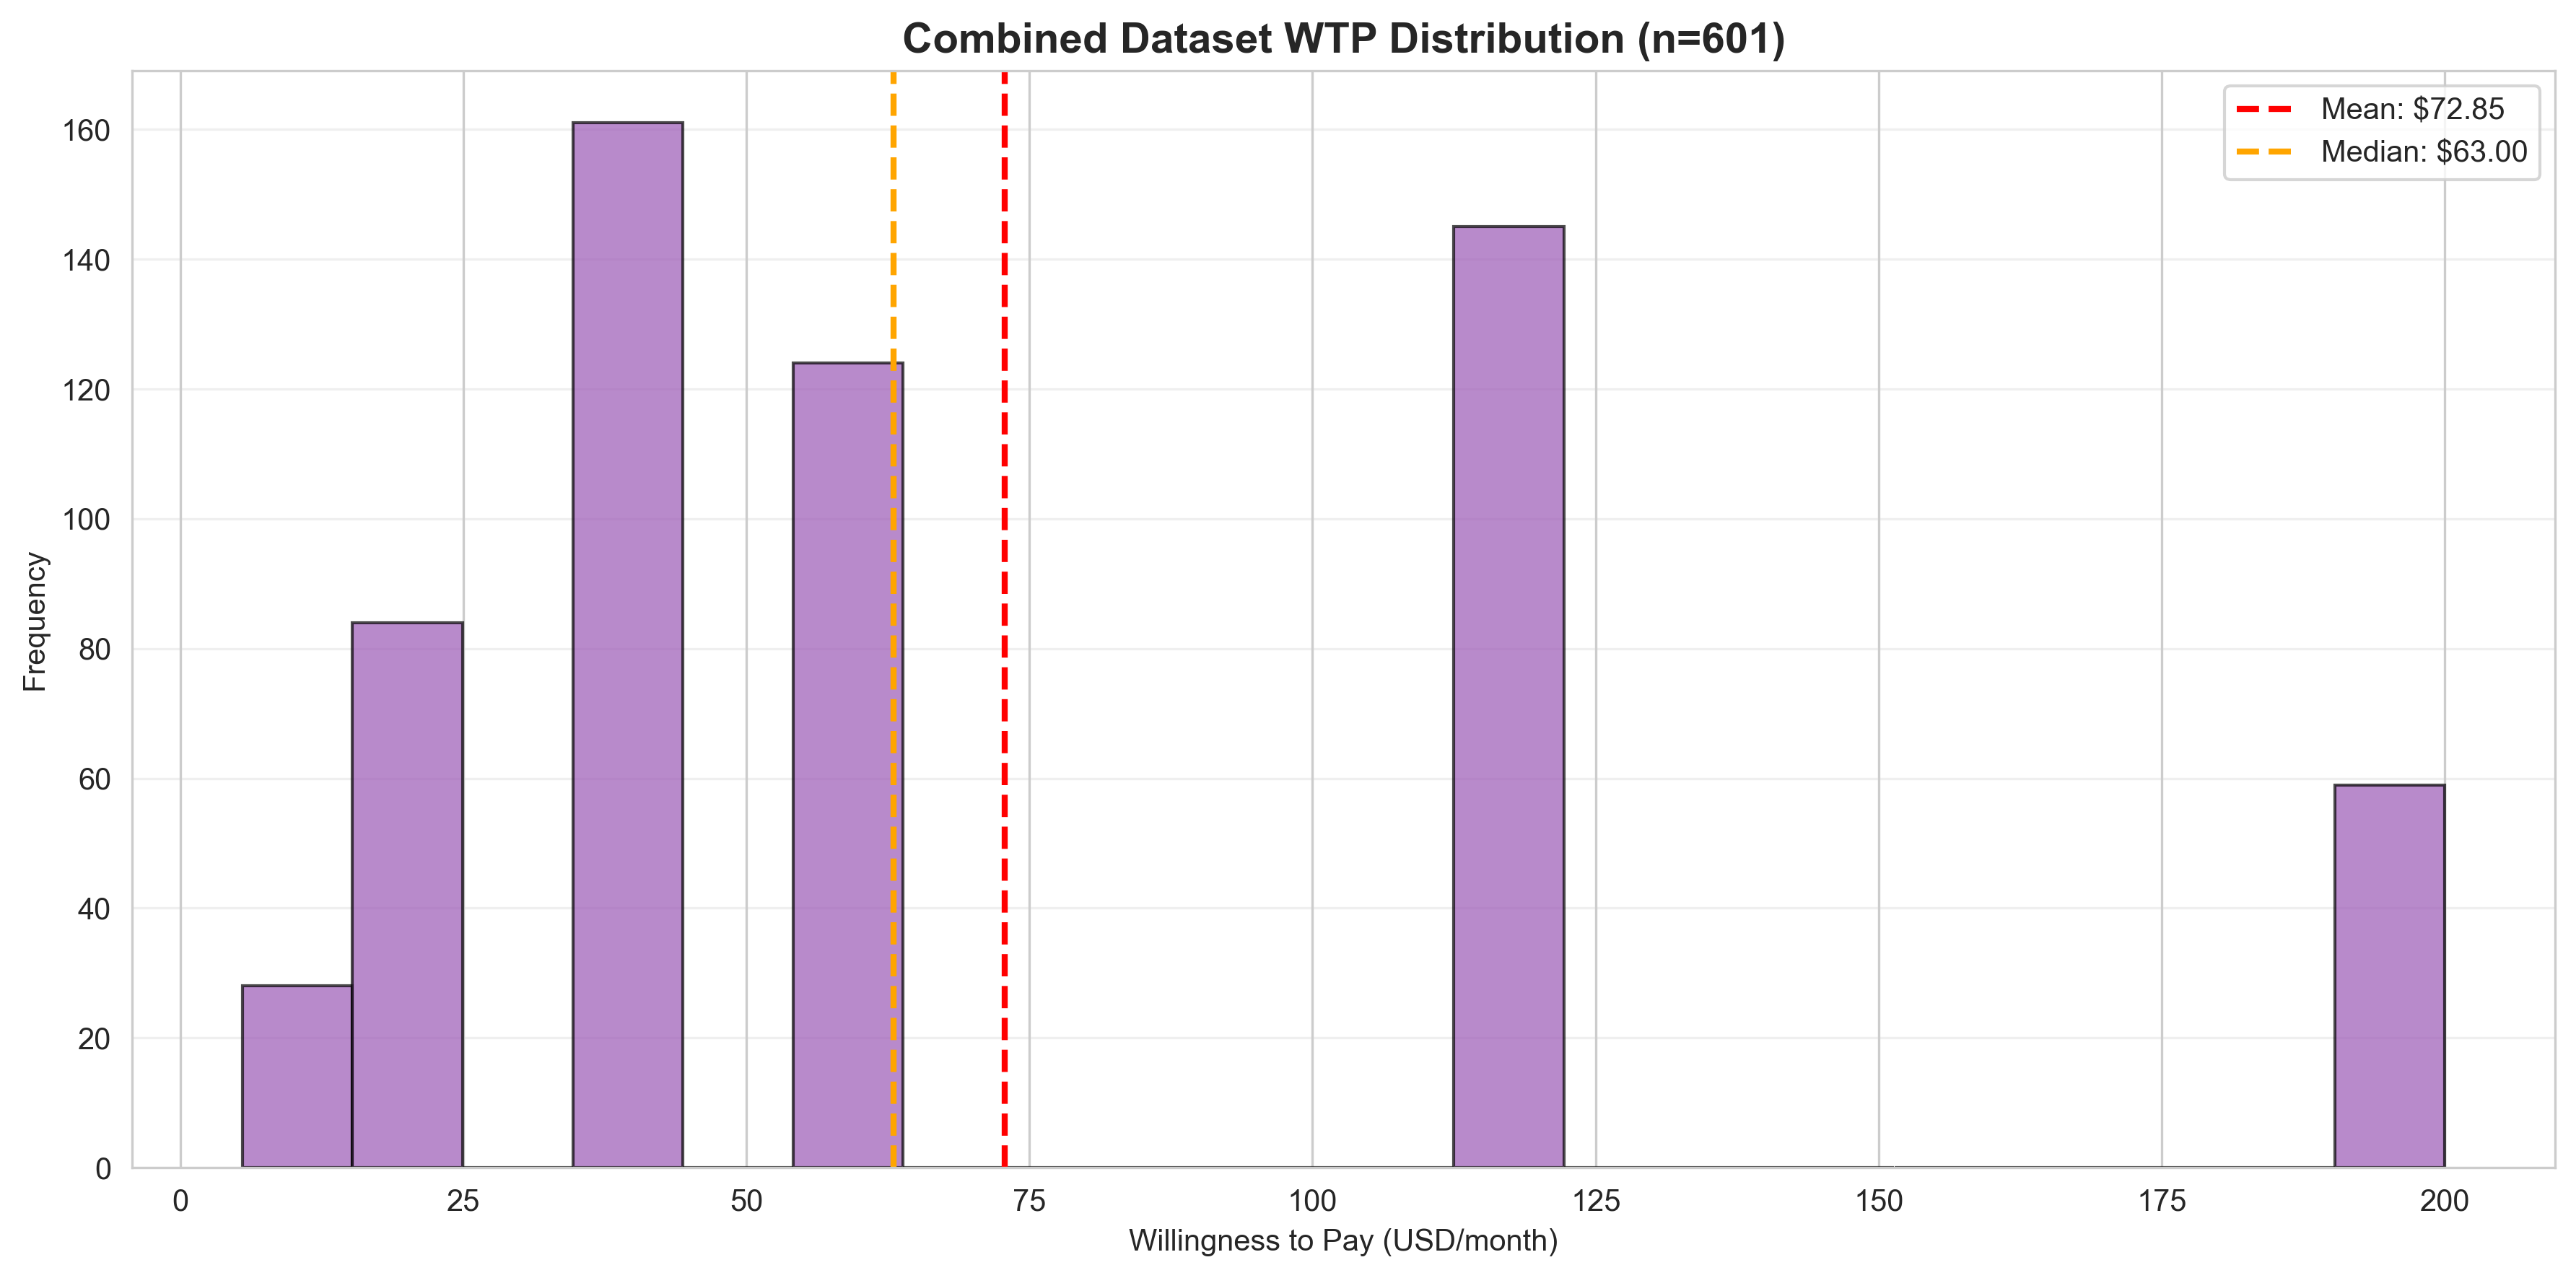
Merged distribution showing all 601 responses. Mean $72.85, Median $63. Clear premium market with right-skew indicating high-value opportunities. Smooth distribution validates sample compatibility.
Combined WTP by Persona
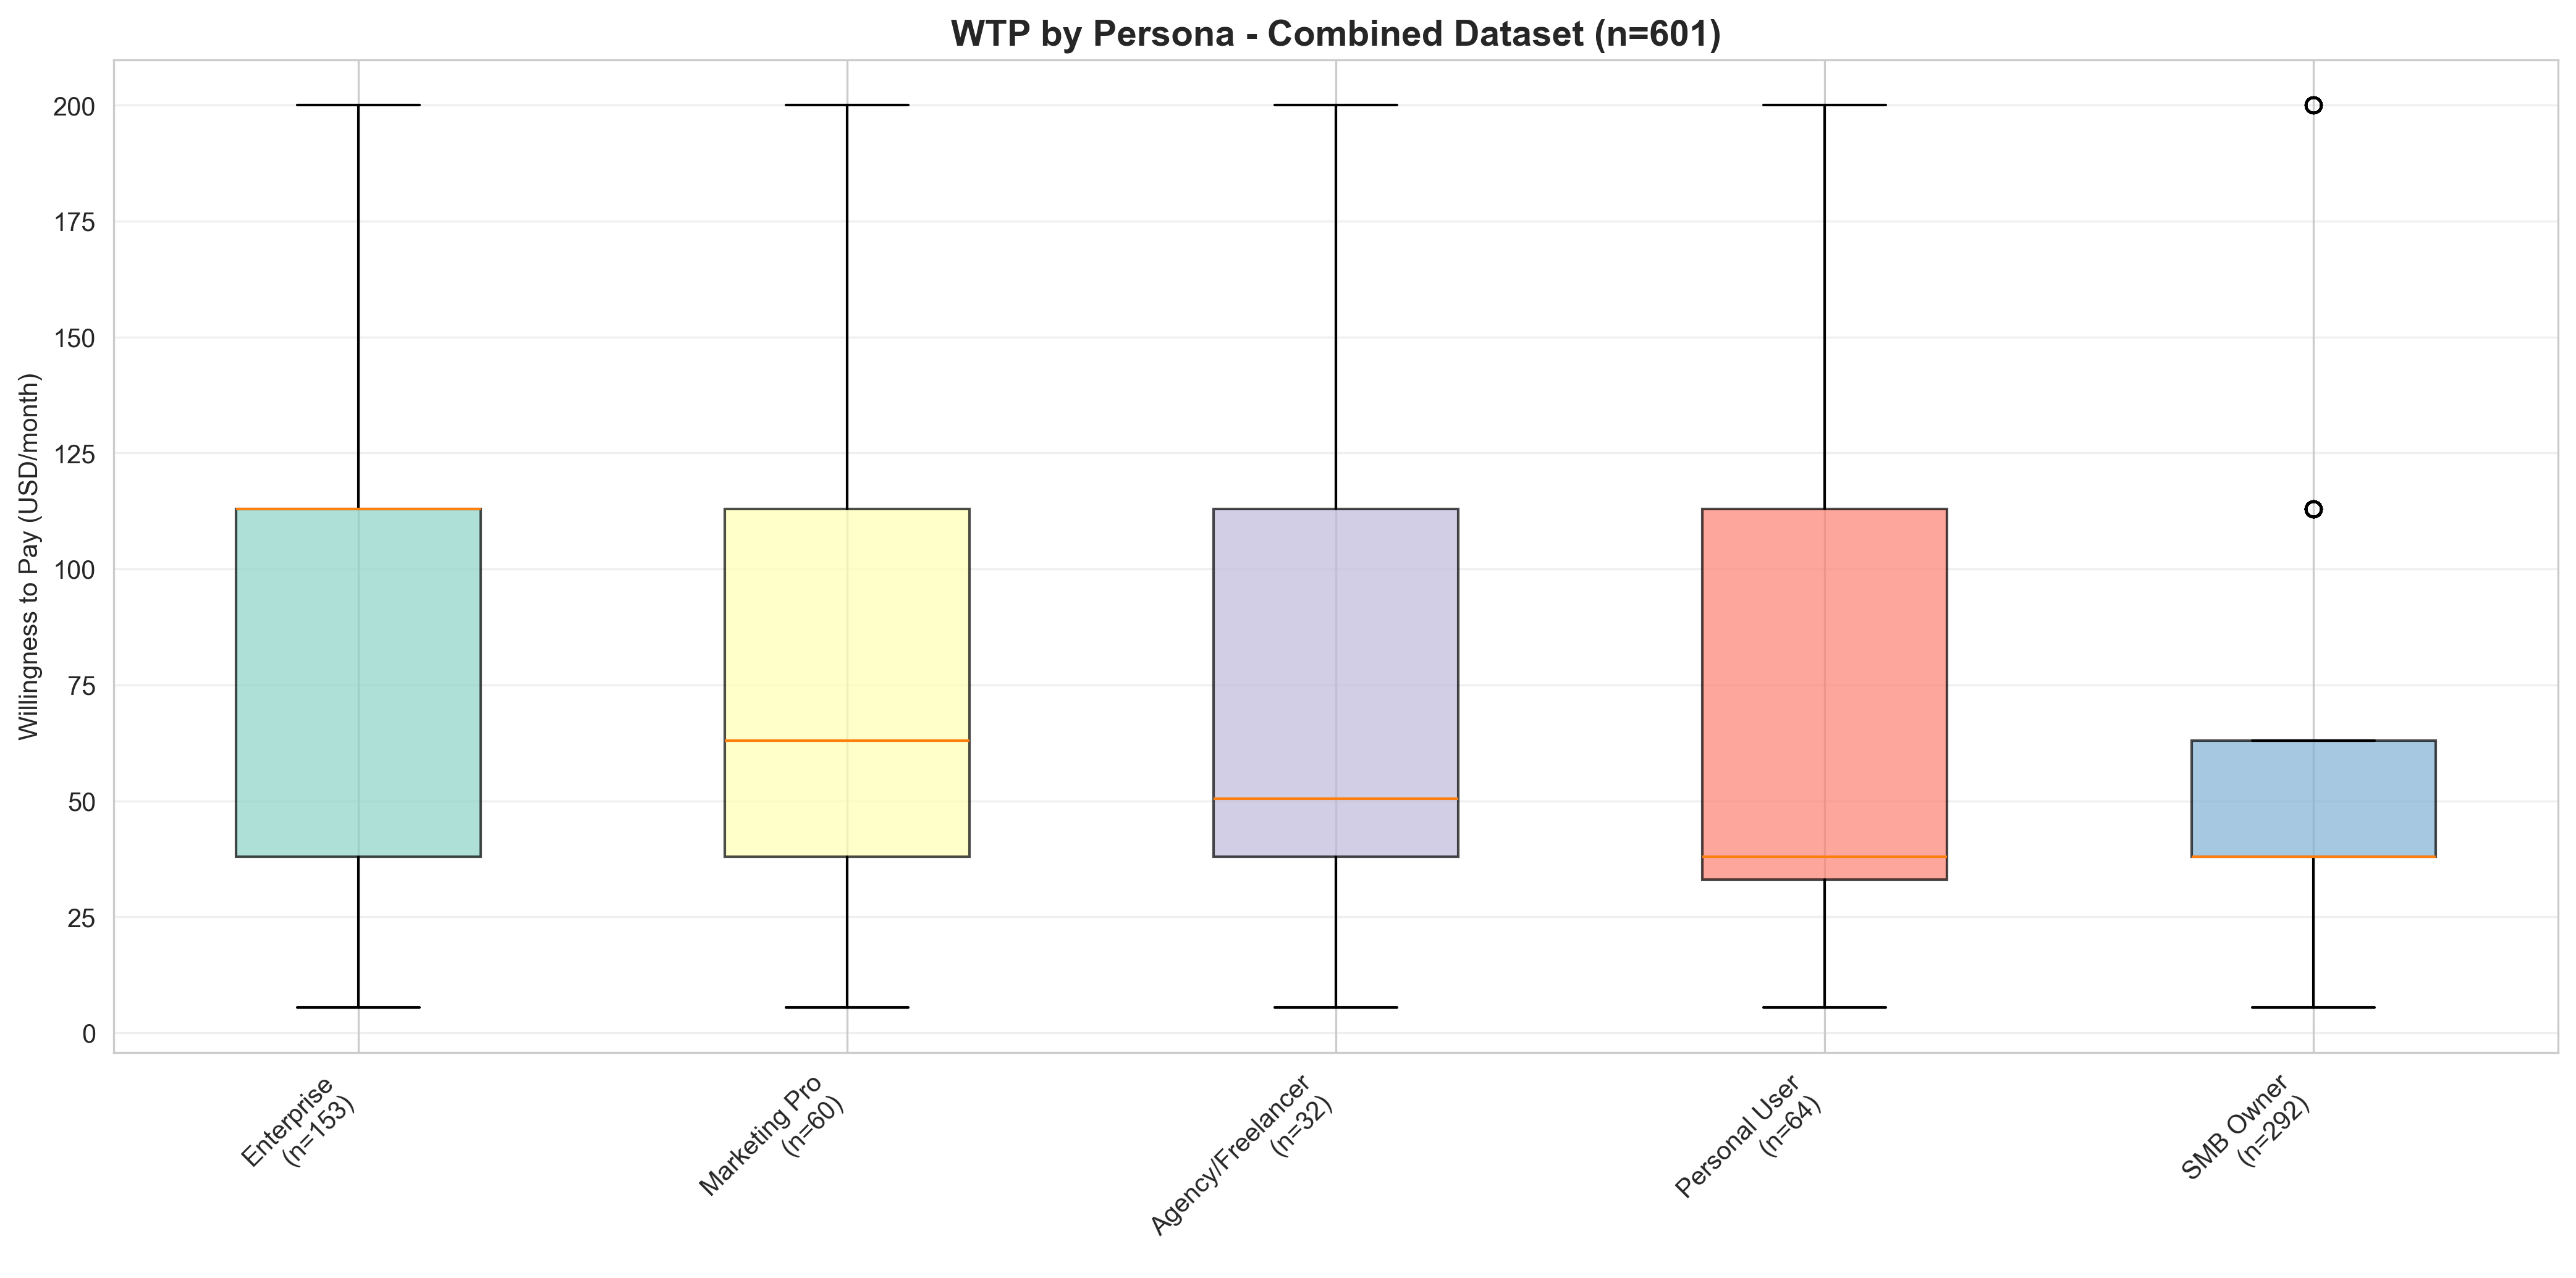
WTP distributions for all 5 personas using combined dataset (n=601). Enterprise leads ($91 mean), followed by Marketing ($82). Larger sample sizes provide more reliable persona profiles.
Technology Preference Shifts
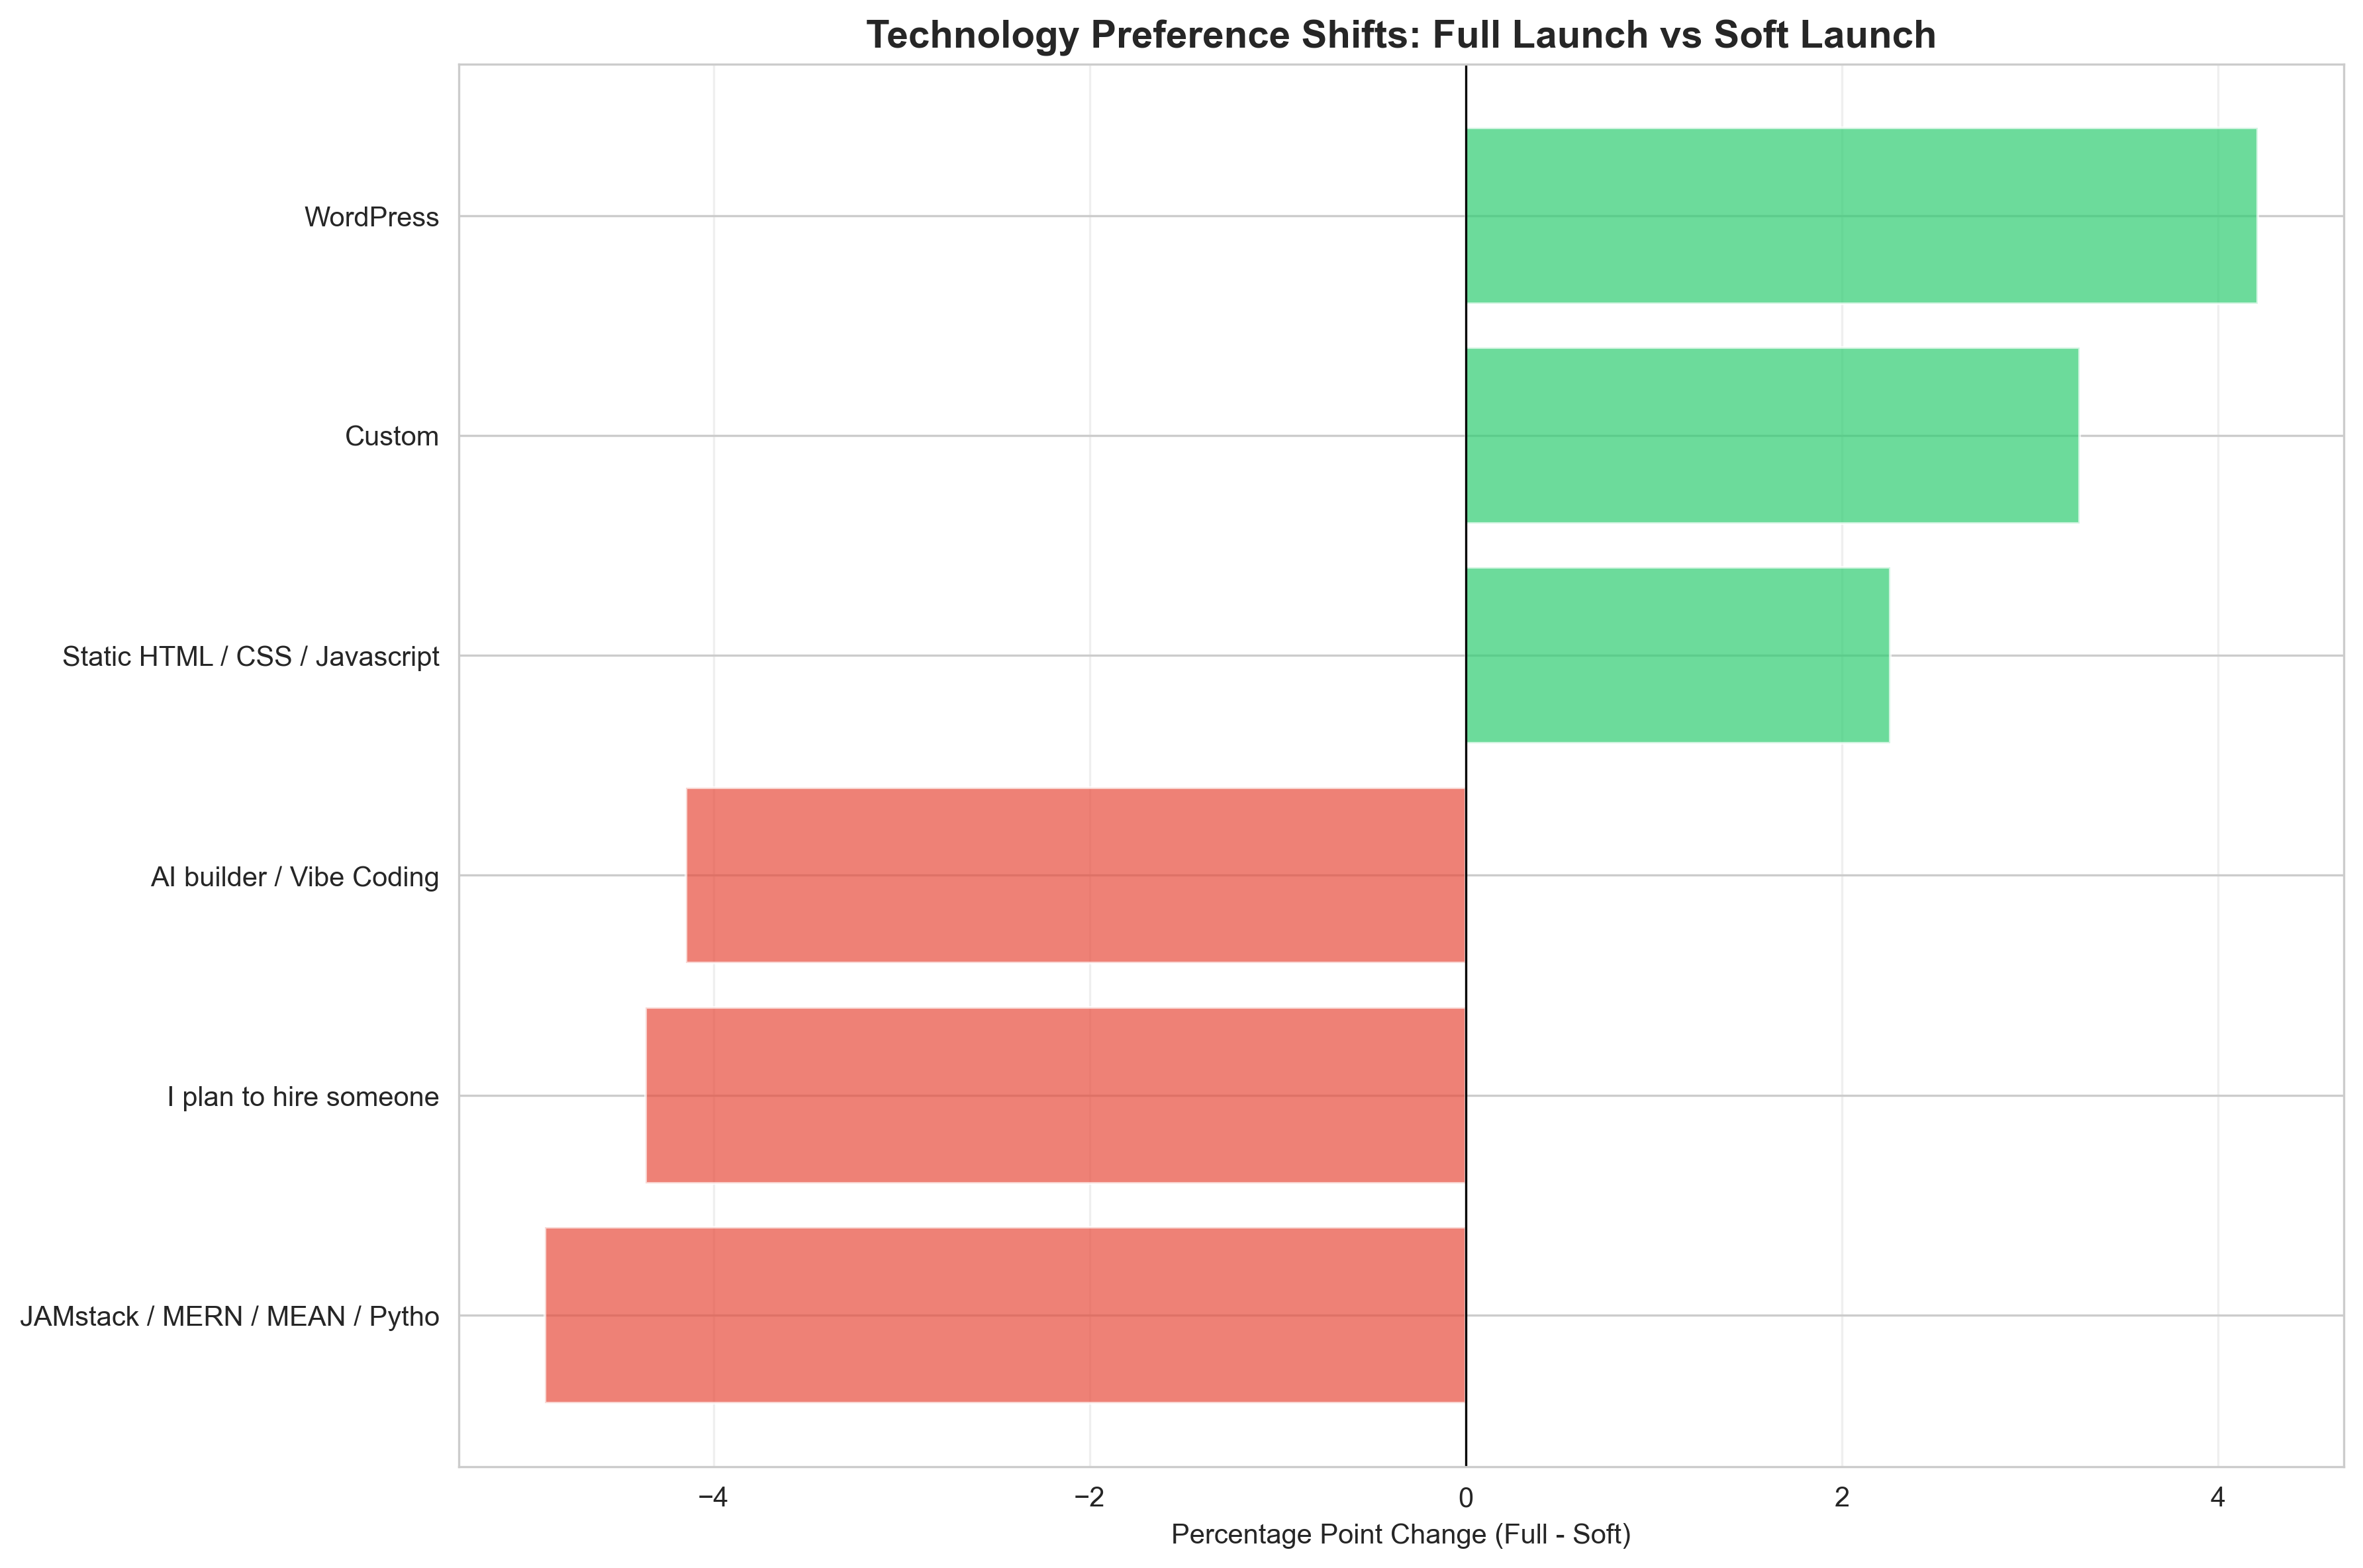
Technology platform preferences across launches. Consistent interest in AI/Vibe Coding and modern frameworks. Full launch shows better representation of diverse technology stacks.
🔬 Methodology
Statistical Tests Used
- Chi-Square Test: Categorical distributions (persona, budget)
- Independent t-Test: Comparing means (WTP)
- Mann-Whitney U: Non-parametric alternative
- Cohen's d: Effect size measure
Significance Level
- α = 0.05: 5% significance level
- Two-tailed tests: Detect differences in either direction
- Conservative approach: Lower risk of false positives
Effect Size Interpretation
Cohen's d thresholds:
- < 0.2: Negligible
- 0.2 - 0.5: Small
- 0.5 - 0.8: Medium
- > 0.8: Large
Our result: d = -0.168 (Negligible)
Quality Checks
- All respondents are decision-makers
- 100% attention check pass rate
- Consistent survey instrument
- Same collection period (Dec 2025 - Jan 2026)
✅ Conclusion
Statistical Validation Complete
All three statistical tests confirm sample compatibility:
- ✅ Persona distribution: No significant difference (p = 0.845)
- ✅ Budget distribution: No significant difference (p = 0.694)
- ✅ WTP means: No significant difference (p = 0.155, d = -0.168)
Recommendation: Use combined dataset (n=601) for maximum statistical power and most reliable insights. The soft launch (n=84) and full launch (n=517) samples come from the same population and can be safely combined.
Next Steps
- Review Combined Dataset Results (n=601) ⭐ - Most comprehensive analysis with maximum statistical power
- Implement pricing strategy - Use combined dataset quartiles ($38, $63, $113) for tier pricing
- Build persona targeting - Leverage larger sample sizes for all 5 personas
- Prioritize features - Use enhanced statistical power to detect feature-WTP correlations