Strategic Segment Visualizations
All visualizations are high-resolution (300 DPI) and ready for presentations. Click any chart to view full-size. These charts show five strategic customer segments (Segments A-E) based on Jobs-to-be-Done analysis of 500 survey responses.
1. Segment Distribution
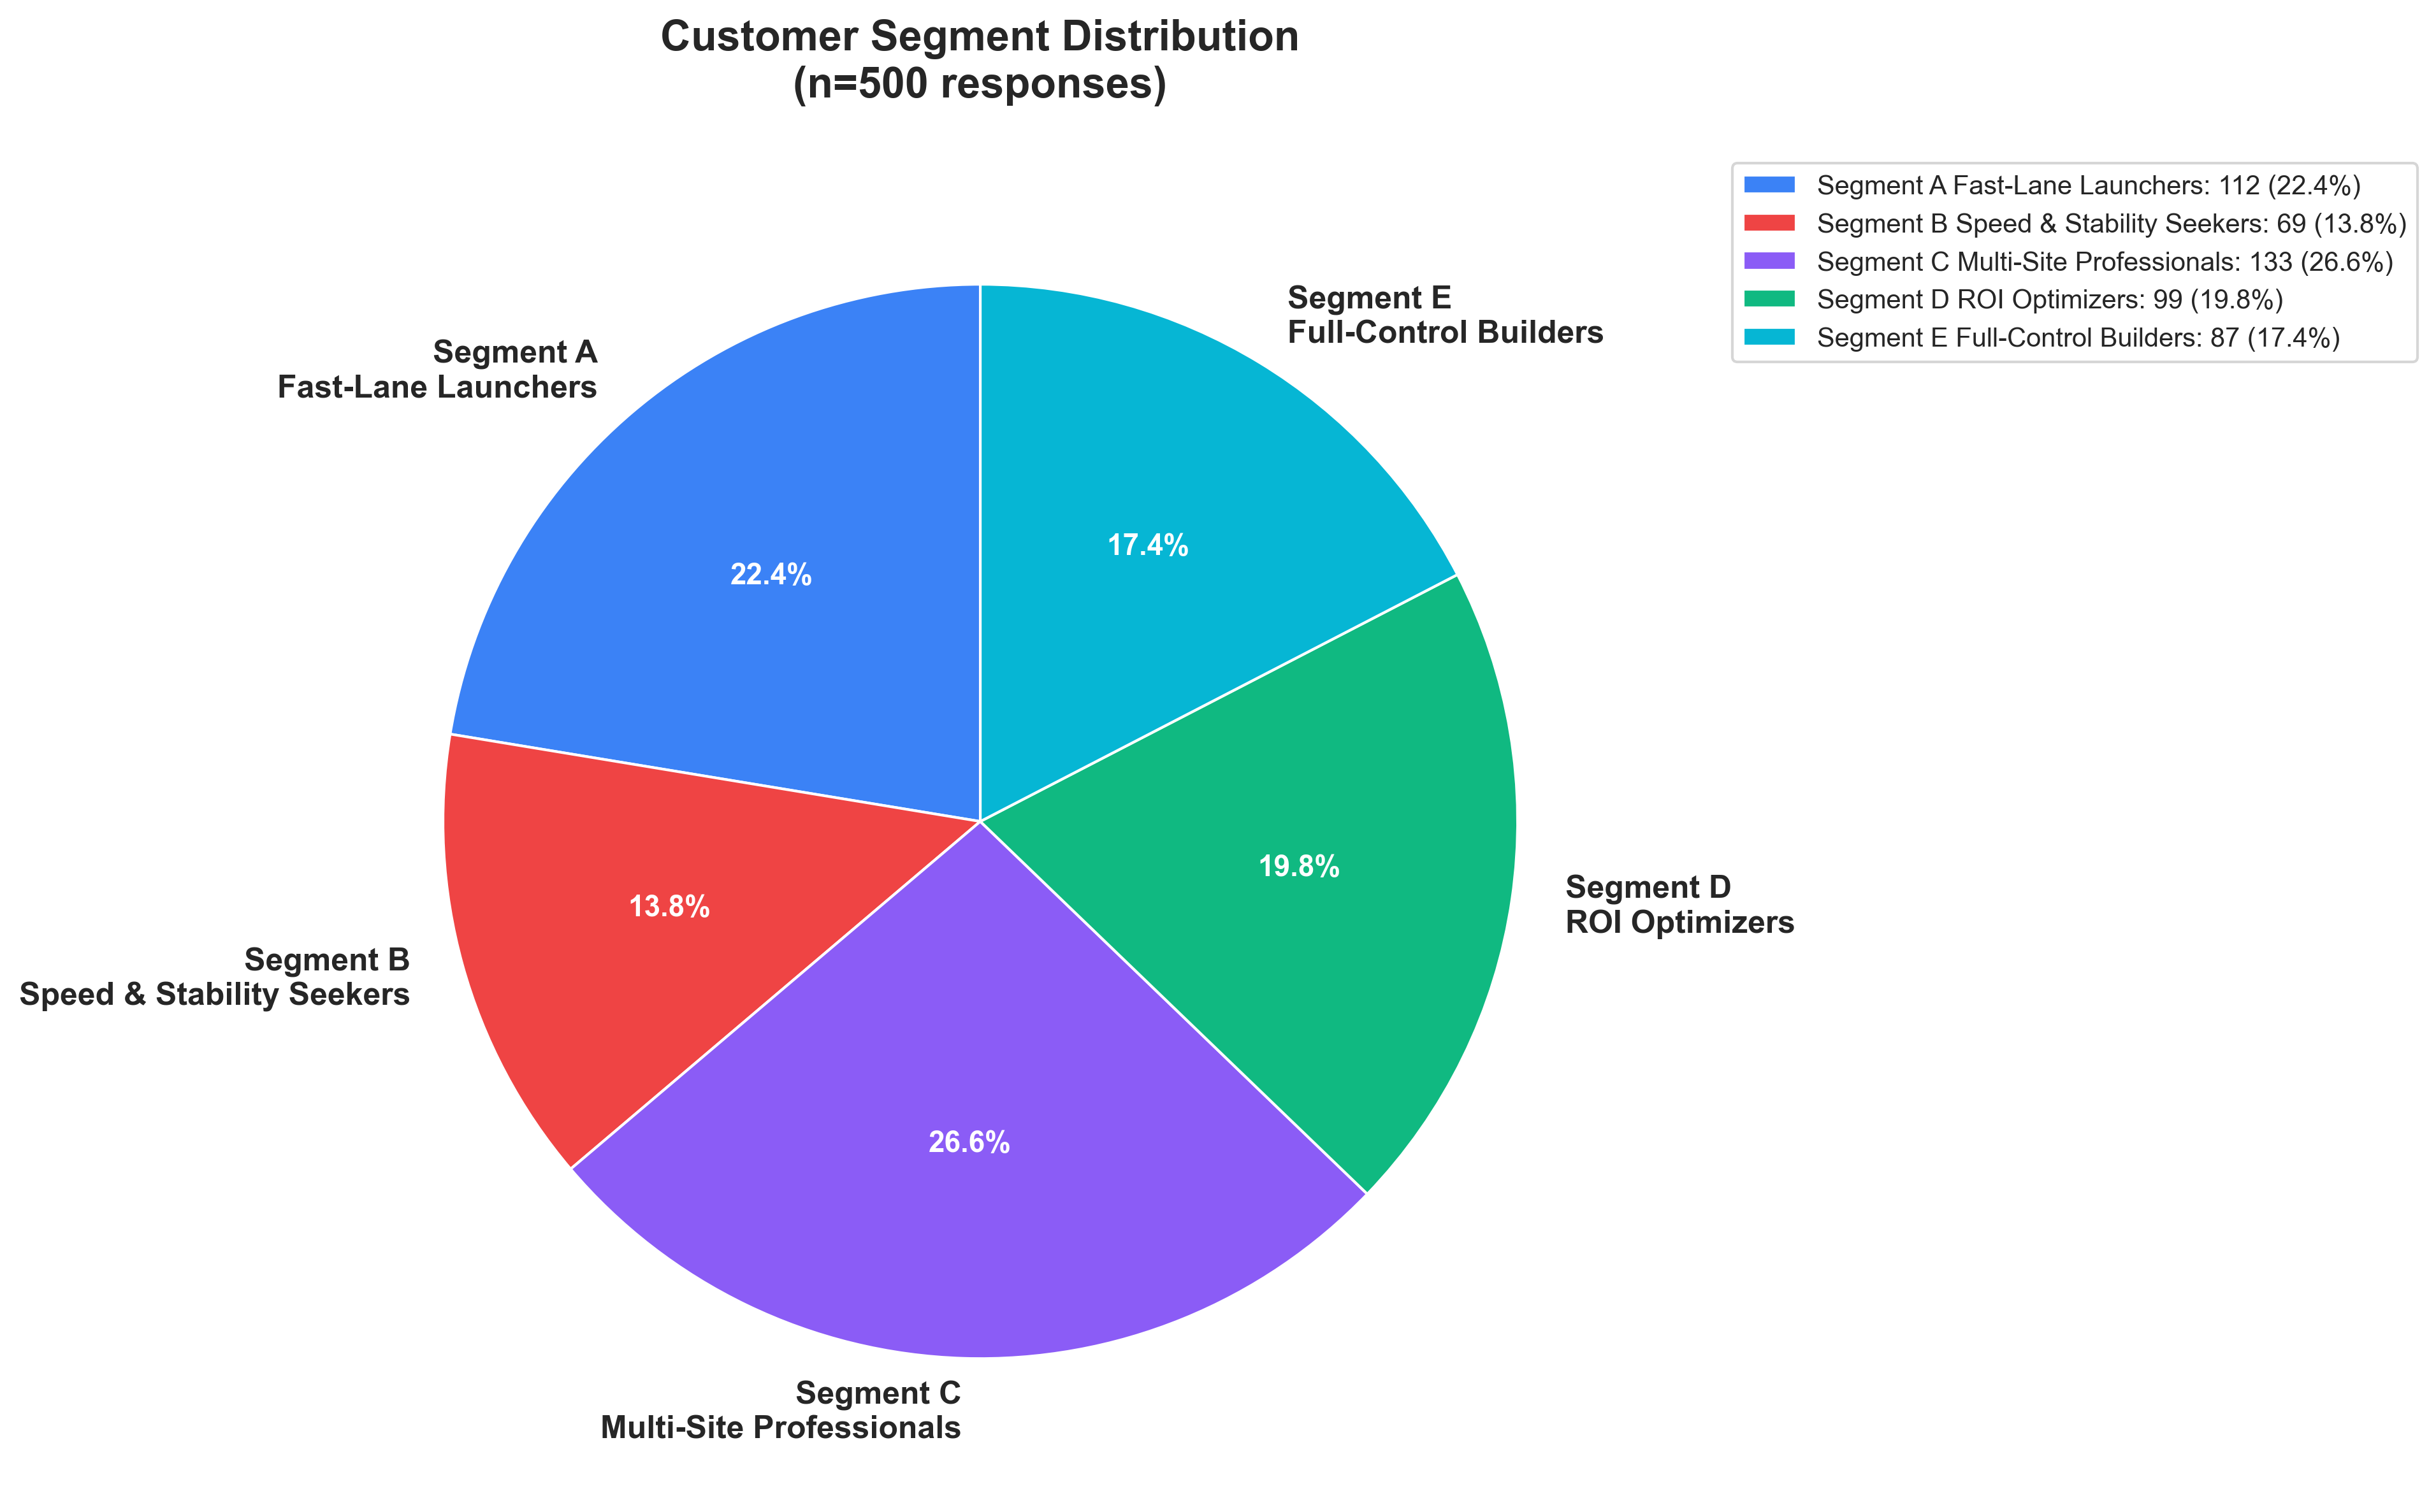
Distribution of 500 survey responses across 5 strategic customer segments (Segments A-E)
This visualization shows:
- Even distribution across strategic segments
- Segment sizes ranging from 84 to 112 respondents
- Each segment represents distinct Jobs-to-be-Done and customer needs
- Color-coded segments (A-E) for easy identification across all charts
Key Insight: Well-balanced strategic segments provide robust foundation for targeted pricing and product positioning decisions.
2. Willingness to Pay Analysis by Segment
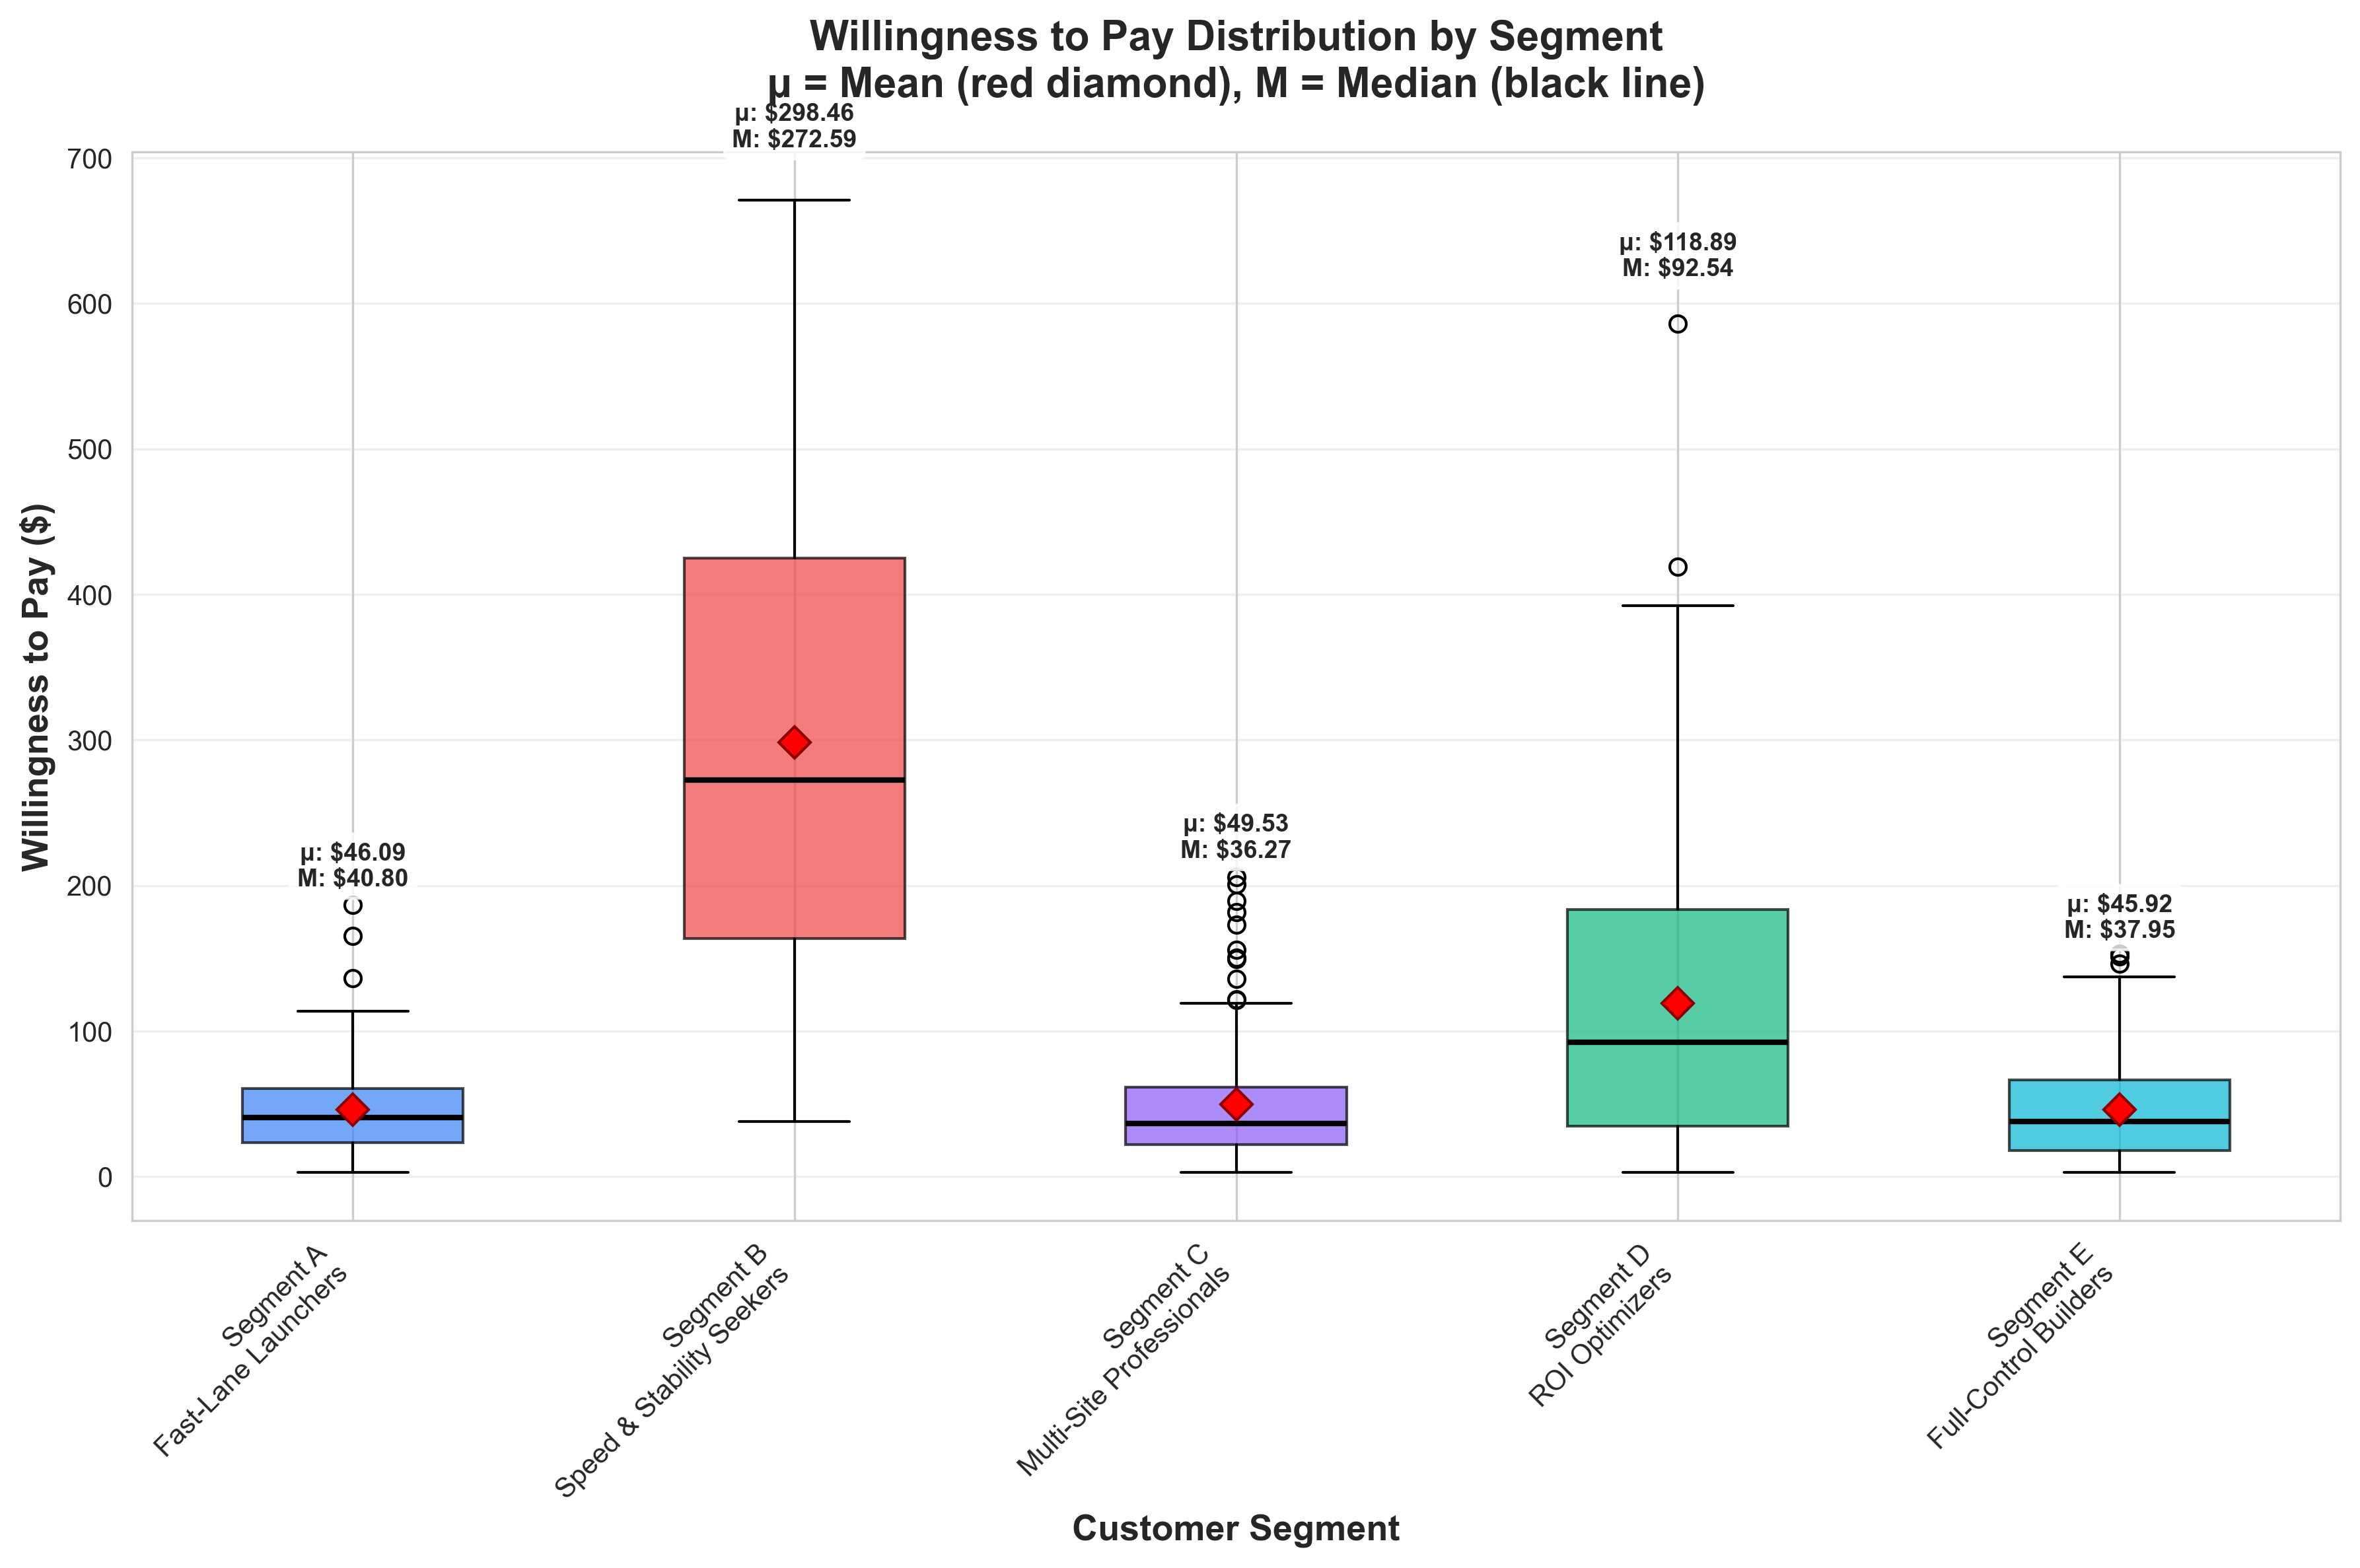
Box plots showing WTP distribution for each segment with mean and median markers
Comprehensive WTP analysis:
- Clear differentiation in willingness to pay across segments
- Statistical markers showing quartiles, outliers, and central tendencies
- Wide variance within segments indicates pricing flexibility
- Overlapping distributions suggest opportunities for value-based positioning
Key Insight: Strategic segments show distinct WTP profiles enabling targeted pricing strategies for each customer group.
3. Feature Preferences by Segment
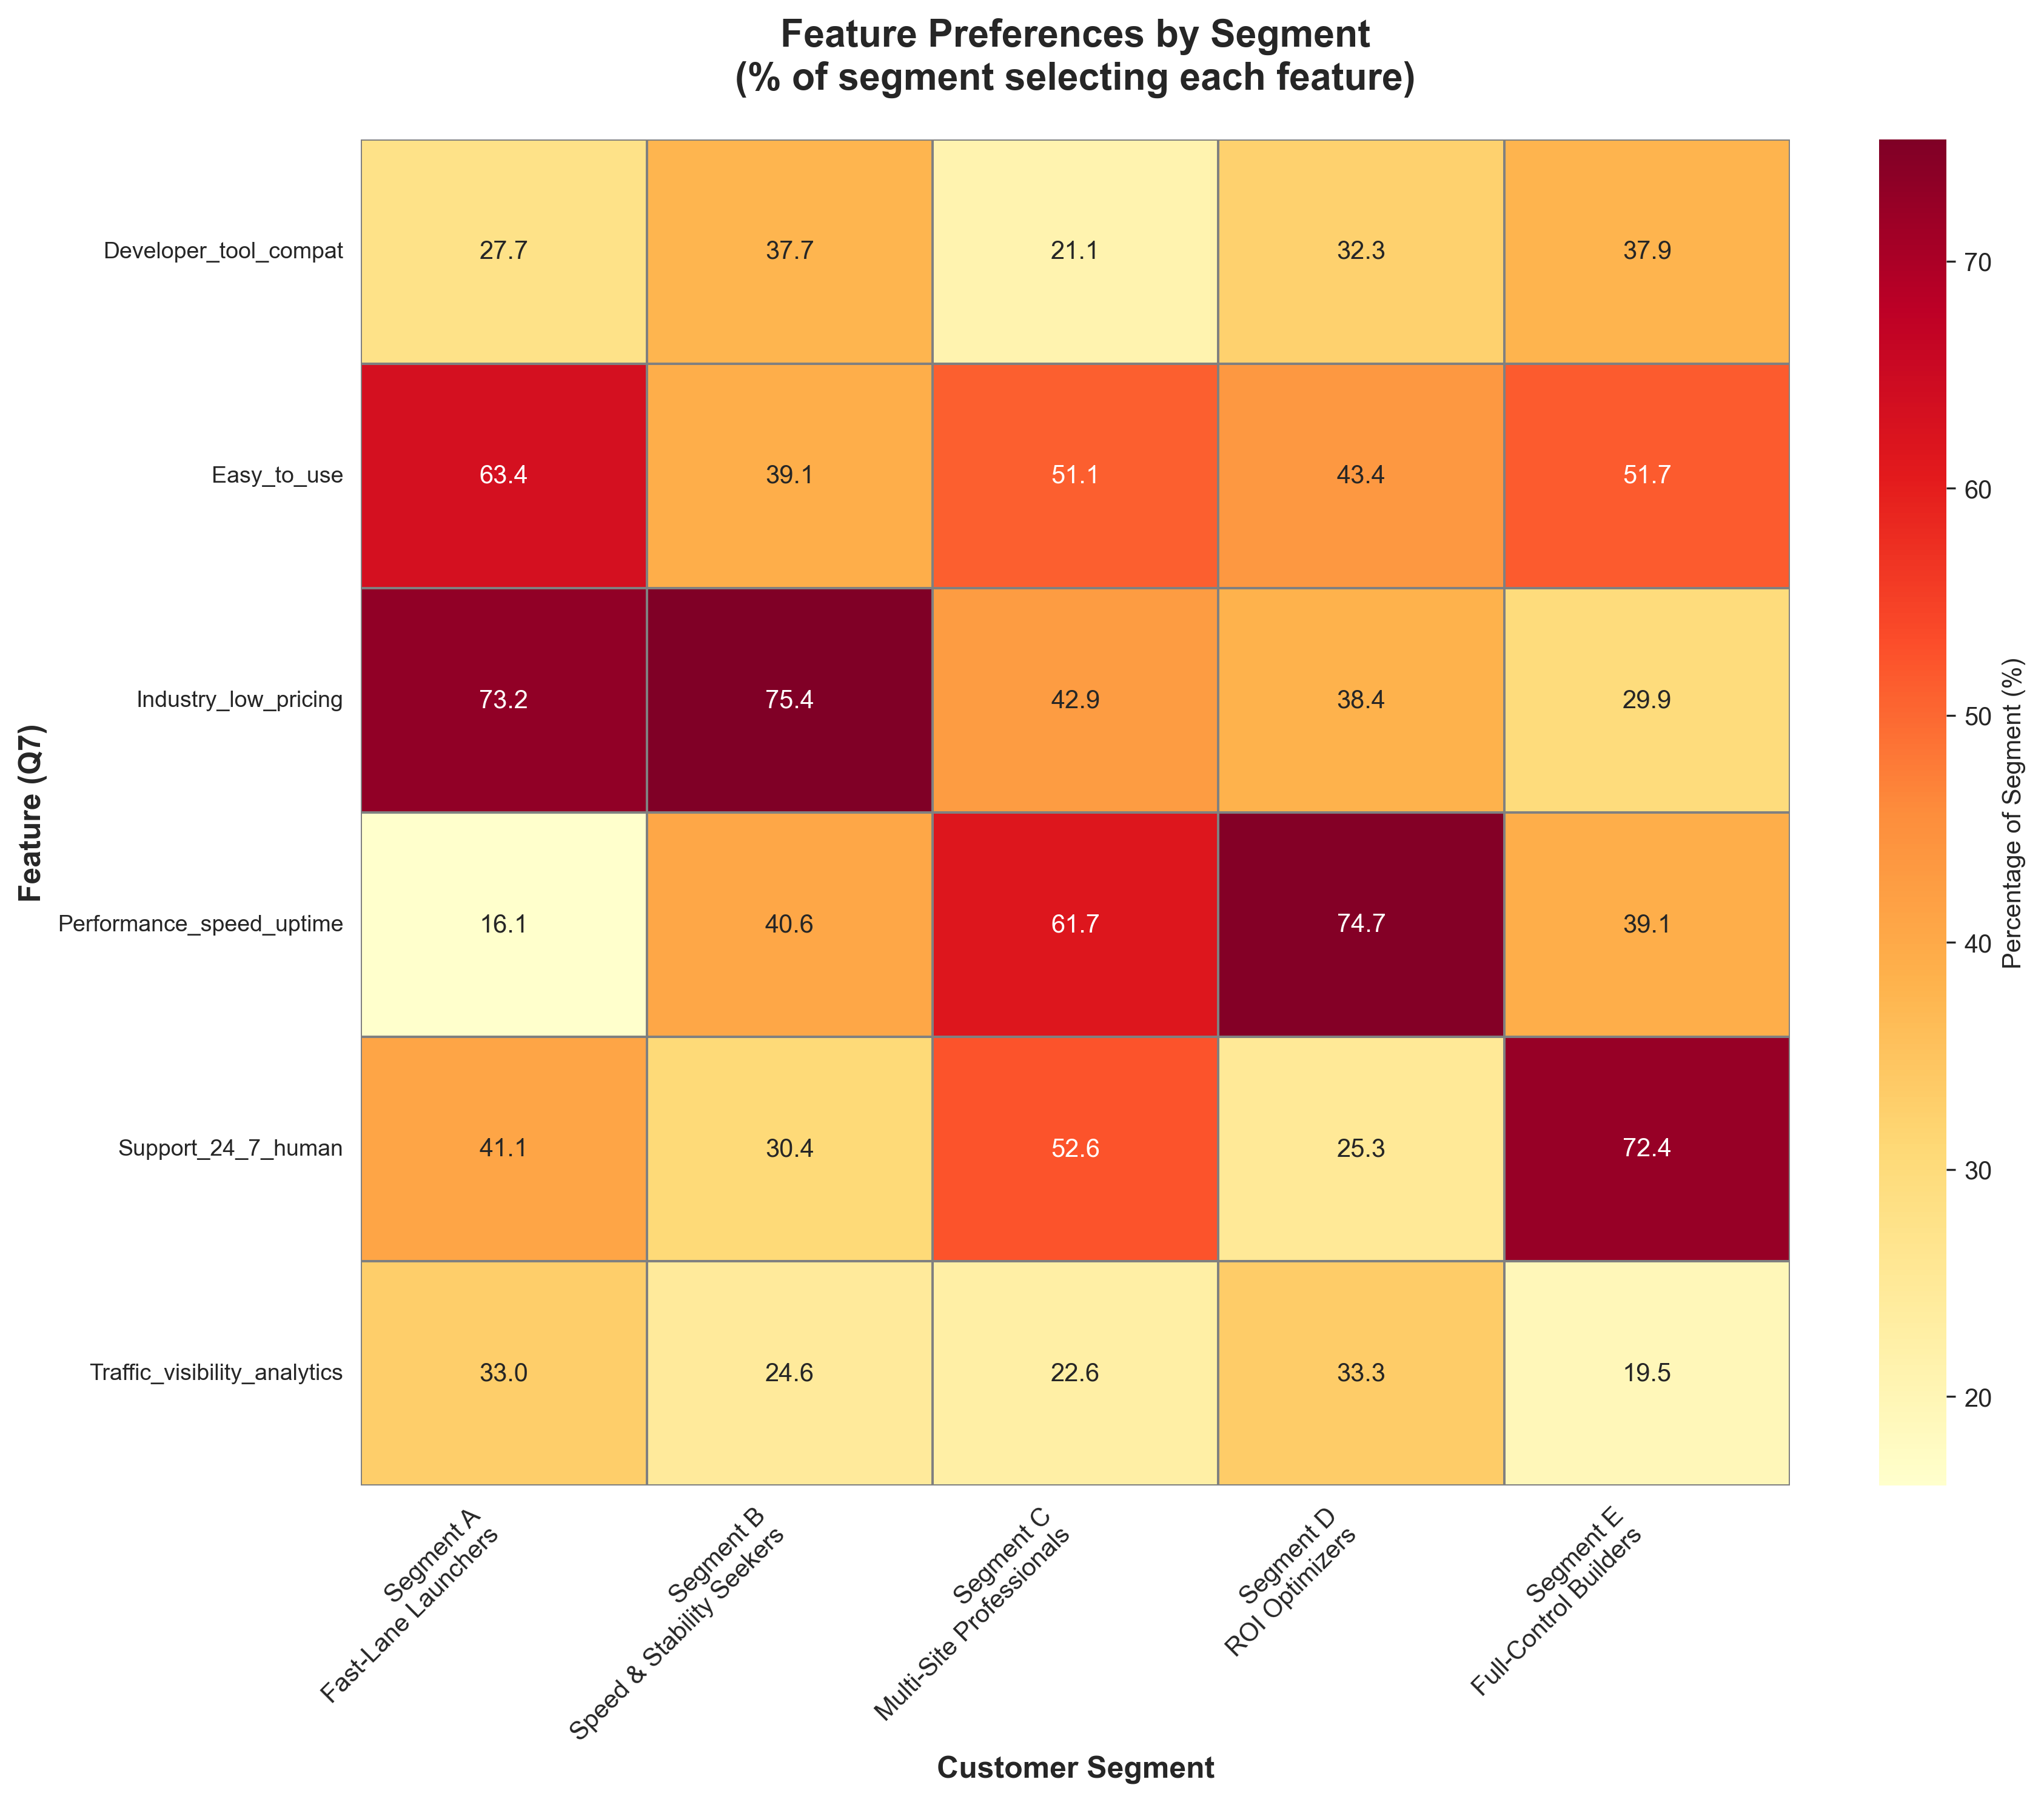
Heatmap showing which hosting features are most valued by each segment
Feature preference analysis:
- Color intensity indicates feature importance within each segment
- Distinct patterns reveal segment-specific needs and priorities
- Universal features (high across all segments) vs segment-specific differentiators
- Feature bundling opportunities identified by correlation patterns
Key Insight: Different segments prioritize different features - one-size-fits-all packaging misses revenue opportunity.
4. Segment Characteristics Comparison
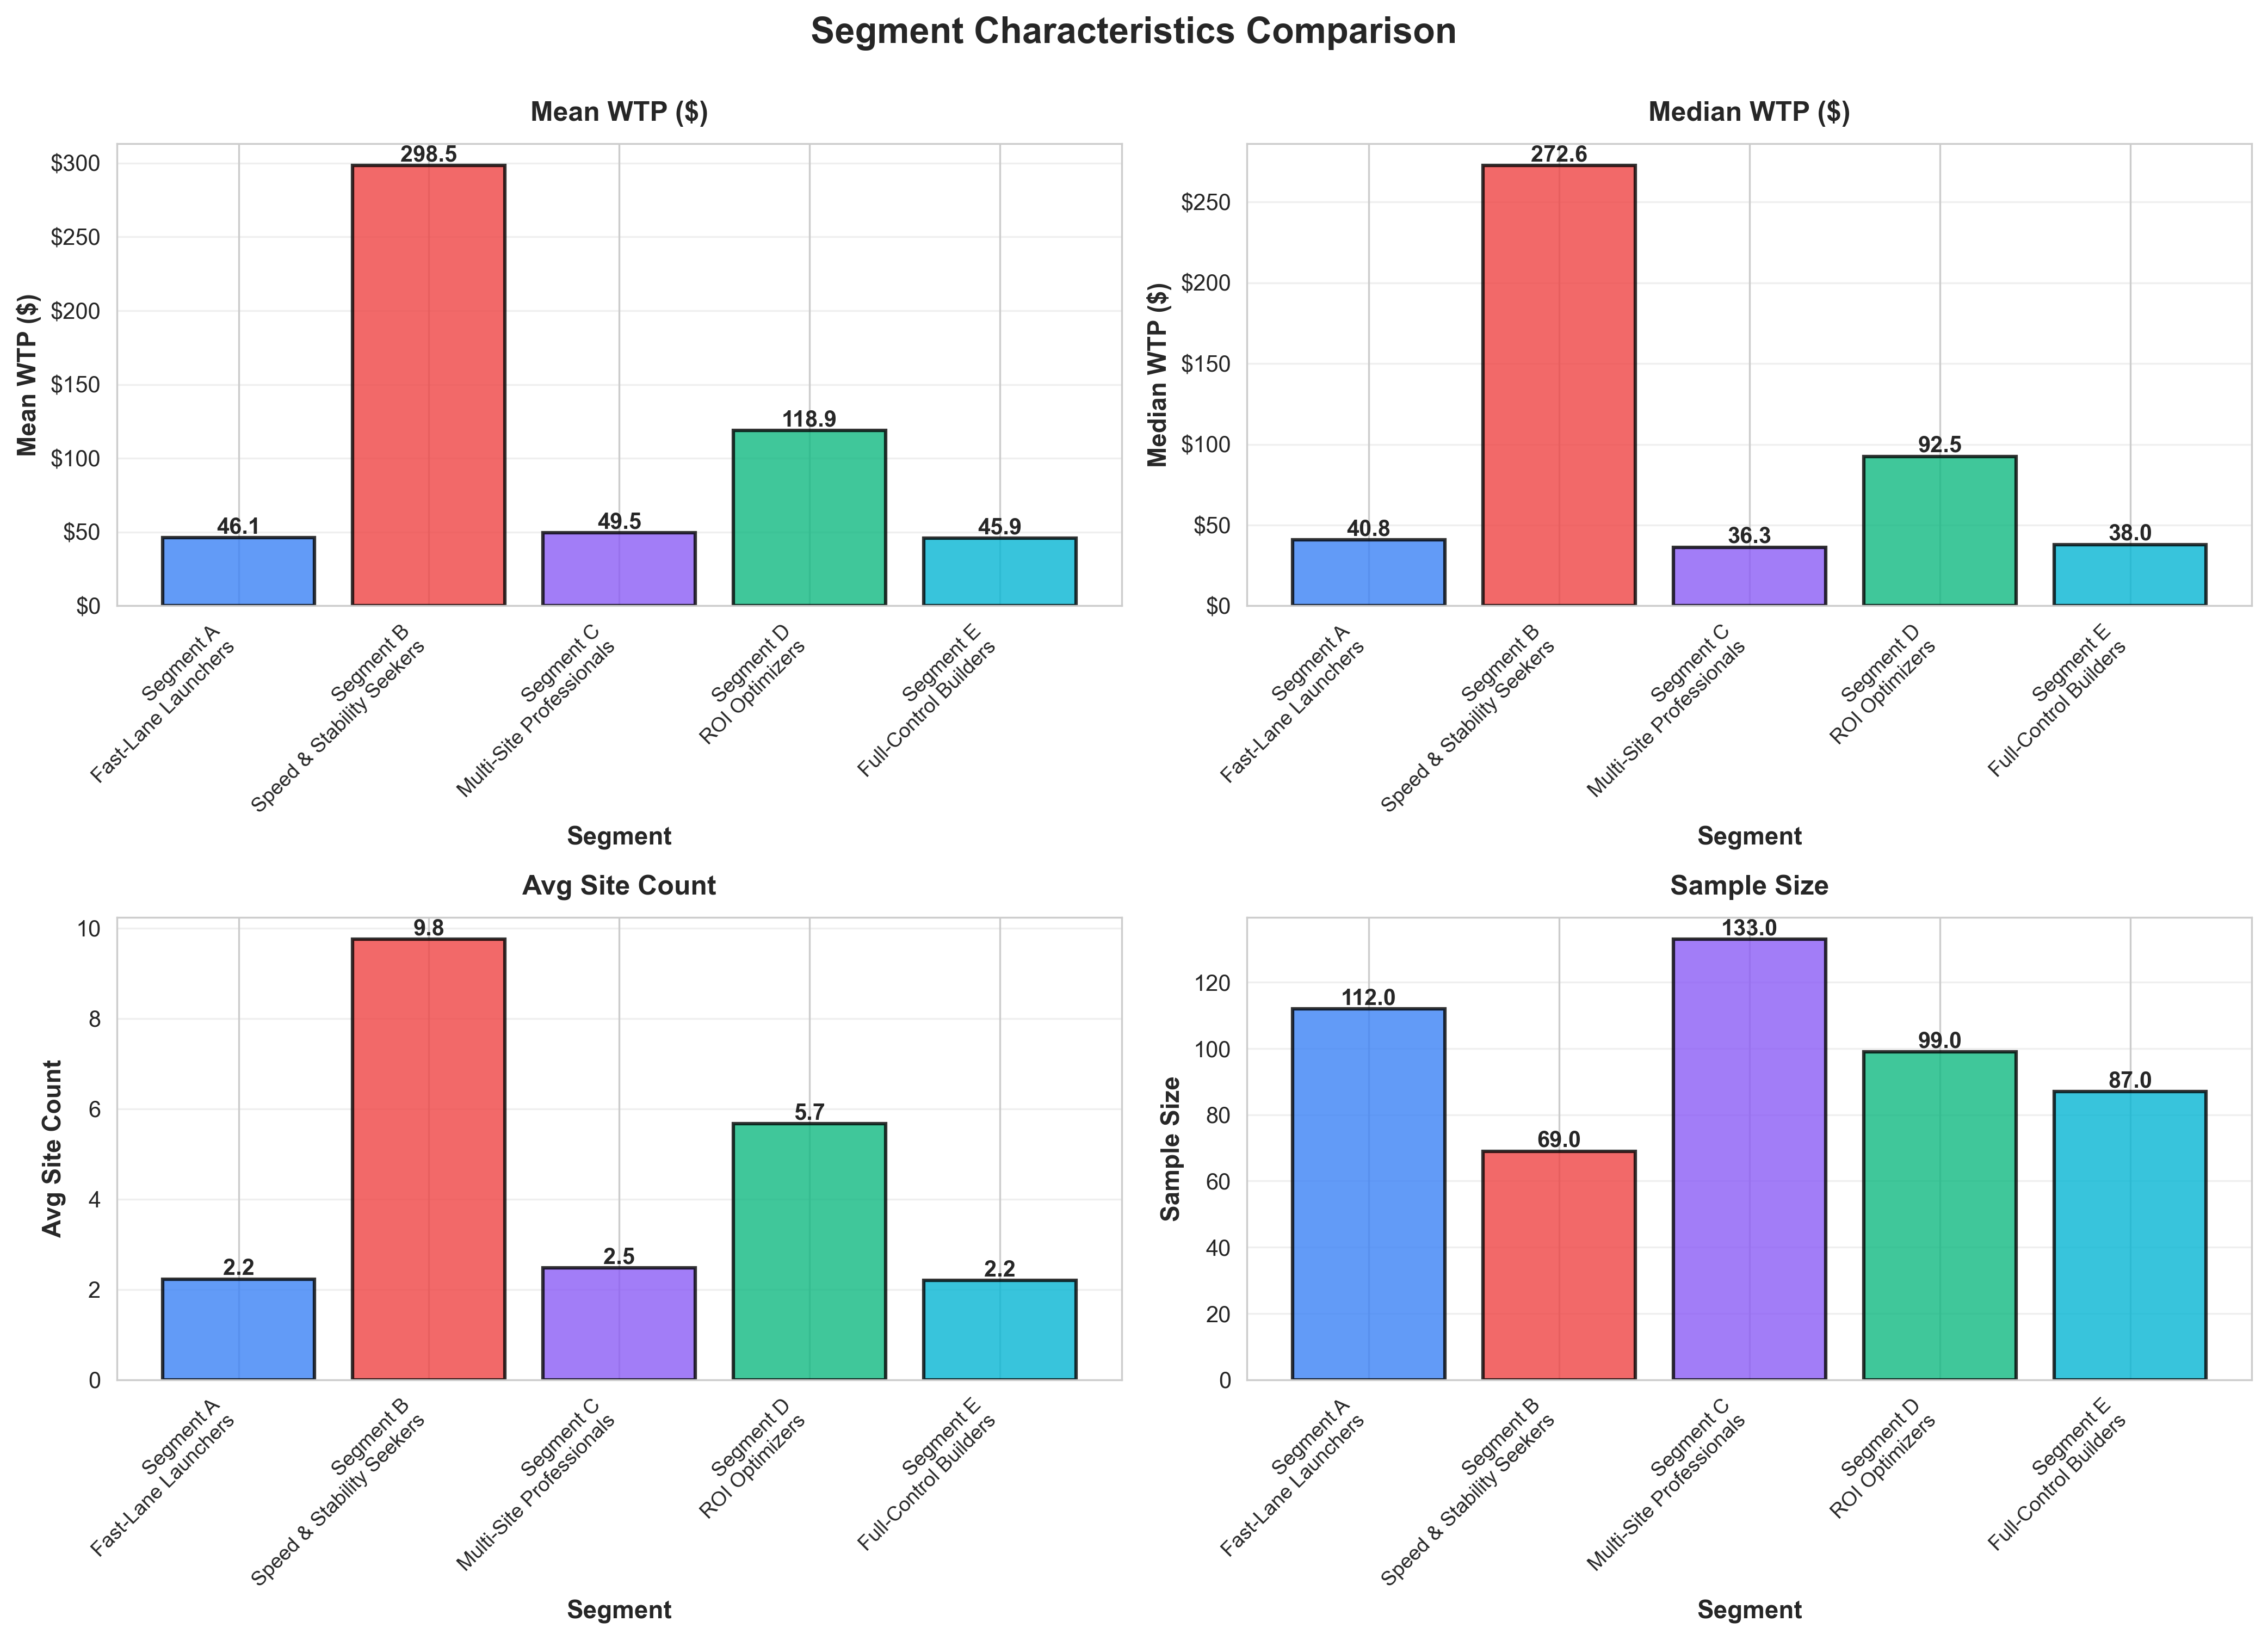
Comparative analysis of key metrics across all 5 strategic segments (A-E)
Multi-dimensional segment profiling:
- Comprehensive comparison of WTP, feature preferences, and behavior
- Clear segment differentiation across multiple dimensions
- Statistical validation of segment distinctiveness
- Actionable profiles for marketing and product positioning
Key Insight: Strategic segments reveal distinct customer Jobs-to-be-Done that align with real customer needs and priorities.
📈 Chart Generation Details
Technical Specifications
- Resolution: 300 DPI (print-ready quality)
- Format: PNG with transparency support
- Dimensions: 1200×800 pixels (standard), 1600×1200 (multi-panel)
- Libraries: matplotlib 3.5+, seaborn 0.11+, scikit-learn
- Segmentation: 5 strategic segments based on Jobs-to-be-Done framework (Segments A-E)
- Style: Professional whitegrid theme with custom color palettes
- Accessibility: Color-blind friendly palettes used
Regeneration Instructions
All segment visualizations can be regenerated by running the segmentation analysis script:
cd /Users/dkuciel/Visual\ Studio\ Code/2025-11\ WTP\ 2.0
python3 analyze_segments.py
Charts will be saved to the analysis/ directory with identical filenames.
Segment Analysis Data
Download the complete segment profiles with statistical summaries:
- Segment Profiles CSV: segment_profiles.csv
- Full Dataset: segmented_web_hosting_data.csv